
Last verified: 13 August 2026. Prices change frequently — check provider pages before budgeting.
Ask what a token costs and you will get an answer to a question you did not ask.
There are three distinct numbers, and almost every discussion slides between them without noticing.
The list price is what a provider publishes — $5 per million input tokens, $25 per million output. This is a price, not a cost.
The blended effective rate is what you actually pay once your real request shape, caching, batching and reasoning tokens are accounted for. This is the number on your invoice.
The serving cost is what it costs in GPU time to produce a token. This is what the provider pays, and what you pay if you self-host.
The gap between list price and serving cost is provider margin. The gap between list price and your blended rate is engineering. Both are large, and each responds to completely different decisions.
Key Takeaways
- “Cost per token” means three different numbers: the list price, your blended effective rate, and what it costs to physically serve a token. Confusing them is where budgets break.
- Headline input price predicts almost nothing. At a typical 1,000-in/500-out request shape, GPT-5.6 Sol’s $5 input price produces a blended rate of $13.33 per million tokens.
- Self-hosted cost figures are meaningless without a stated batch size. The same H100 at the same hourly rate ranges from $0.17 to $8.74 per million output tokens depending purely on throughput.
- utilization dominates everything. A GPU running at 10% load costs ten times as much per token as the same GPU at full load.
- GPT-4-class capability fell from roughly $20 per million tokens in late 2022 to about $0.40 in 2026 — a decline steeper than PC compute or dotcom-era bandwidth.
Quick Navigation
- Layer One: Published Inference Cost Per Token
- Why Headline Inference Cost Per Token Misleads
- Calculating Your Blended Inference Cost Per Token
- The Multipliers Hidden Inside Inference Cost Per Token
- Layer Three: Inference Cost Per Token on Your Own GPUs
- Why Published Self-Hosting Numbers Disagree
- The utilization Problem Nobody Prices
- Why Agents Break Inference Cost Per Token Models
- How Inference Cost Per Token Collapsed
- Cutting Your Inference Cost Per Token
- Primary sources
- Frequently Asked Questions
Layer One: Published Inference Cost Per Token
Current published rates, per million tokens, input/output. Frontier-tier list prices have converged tightly.
Table: scroll sideways to view all columns when needed.
| Model | Input | Output | Tier |
|---|---|---|---|
| Claude Fable 5 | $10 | $50 | Premium reasoning |
| GPT-5.6 Sol | $5 | $30 | Frontier |
| Claude Opus 5 | $5 | $25 | Frontier |
| Claude Sonnet 5 | $2 | $10 | Mid |
| GPT-5.6 Terra | $2 | $12 | Mid |
| Claude Haiku 4.5 | $1 | $5 | High-volume |
| GPT-5.6 Luna | $0.20 | $1.20 | High-volume |
| DeepSeek V4-Flash | $0.14 | $0.28 | Budget |
Sonnet 5 update, checked 16 September 2026: Anthropic retained $2 per million input tokens and $10 per million output tokens as standard pricing. The previously announced 1 September increase was cancelled.
That last row deserves a note in your calendar. A 50% input price increase arriving in under three weeks is exactly the kind of thing that turns a validated cost model into a surprise.
Note also the spread. Between DeepSeek V4-Flash and Claude Fable 5 there is a 71× difference on input and a 178× difference on output. That range is why “what does inference cost” has no single answer.
Why Headline Inference Cost Per Token Misleads
Comparisons almost always quote input price. Input price is the least useful number on the sheet.
Output tokens cost more everywhere, because generating them requires a forward pass per token while input can be processed in parallel. But the multiple varies enormously by provider.
GPT-5.6 Sol charges six times its input rate for output. Claude Opus 5 charges five times. DeepSeek V4-Flash charges twice. Grok 4.3 charges twice.
So two models with identical input prices can differ by 20% or more on your actual bill, depending entirely on how much text your application generates.
Understanding why output costs more requires knowing what the hardware is doing differently in each phase — a distinction covered in our breakdown of inference chips versus training chips.
Calculating Your Blended Inference Cost Per Token
The fix is simple arithmetic that almost nobody does.
Blended rate = (input tokens × input price + output tokens × output price) ÷ total tokens
Take a common request shape: 1,000 input tokens, 500 output tokens. Here is what that does to the rankings.
Table: scroll sideways to view all columns when needed.
| Model | List input | Blended rate |
|---|---|---|
| GPT-5.6 Sol | $5.00 | $13.33 |
| Claude Opus 5 | $5.00 | $11.67 |
| Claude Sonnet 5 | $2.00 | $4.67 |
| Claude Haiku 4.5 | $1.00 | $2.33 |
| GPT-5.6 Luna | $0.20 | $0.53 |
| DeepSeek V4-Flash | $0.14 | $0.19 |
Two observations.
GPT-5.6 Sol and Claude Opus 5 have identical list input prices and a 14% gap in blended rate, purely from the output multiple.
And every blended figure is higher than its headline — between 1.4× and 2.7× higher. If you budgeted from the input column, you underbudgeted.
Run this with your own ratio before choosing a model. A summarisation workload (heavy input, light output) and a code-generation workload (light input, heavy output) will rank providers in different orders.
The Multipliers Hidden Inside Inference Cost Per Token
Four adjustments change the arithmetic, two upward and two downward.
Reasoning tokens (upward). Reasoning models generate intermediate tokens before their visible answer. Those are billed as output. A response that shows 200 tokens may have billed for 2,000. This is the single largest source of unexpected overspend on reasoning-tier models.
Long-context tiers (upward). Gemini 3.1 Pro doubles its rate beyond 200,000 tokens per request, moving from $2/$12 to $4/$18. Grok 4.5 and 4.3 do the same. If your RAG pipeline stuffs context aggressively, you may be paying the higher tier without realizing a tier exists.
Prompt caching (downward). Repeated prefixes — system prompts, few-shot examples, static documents — can be cached. DeepSeek charges roughly $0.0036 per million on cache hits against $0.14 standard, about a 97% reduction. For applications with a large fixed system prompt, this is usually the biggest available saving.
Batch processing (downward). Asynchronous batch endpoints typically halve rates. If your workload tolerates delayed completion, this is free money.
Cache and batch together can move a real bill by an order of magnitude, and neither changes a single line of model output.
Layer Three: Inference Cost Per Token on Your Own GPUs
Self-hosting replaces a per-token bill with a per-hour bill. The conversion is one formula.
Cost per million tokens = (GPU hourly rate ÷ tokens per second ÷ 3,600) × 1,000,000
The hard part is not the formula. It is getting an honest throughput number.
Here is the same H100 at $2.99 per hour, at different throughputs:
Table: scroll sideways to view all columns when needed.
| Throughput | Cost per million output tokens |
|---|---|
| 95 tok/s (single stream) | $8.74 |
| 380 tok/s (batch = 8) | $2.19 |
| 1,000 tok/s | $0.83 |
| 3,000 tok/s | $0.28 |
| 5,000 tok/s | $0.17 |
Same hardware. Same hourly rate. A 51× spread in cost per token.
This is why hourly GPU rates tell you nothing on their own. An H100 at $2.99/hour and an A100 at $1.64/hour are neither expensive nor cheap until you know what each produces. A GPU costing twice as much per hour but generating three times the tokens is 1.5× cheaper per token.
The hardware economics underneath this are covered in more depth in the AI compute stack.
Why Published Self-Hosting Numbers Disagree
Now apply that table to the figures circulating online, because this is where most cost comparisons quietly fall apart.
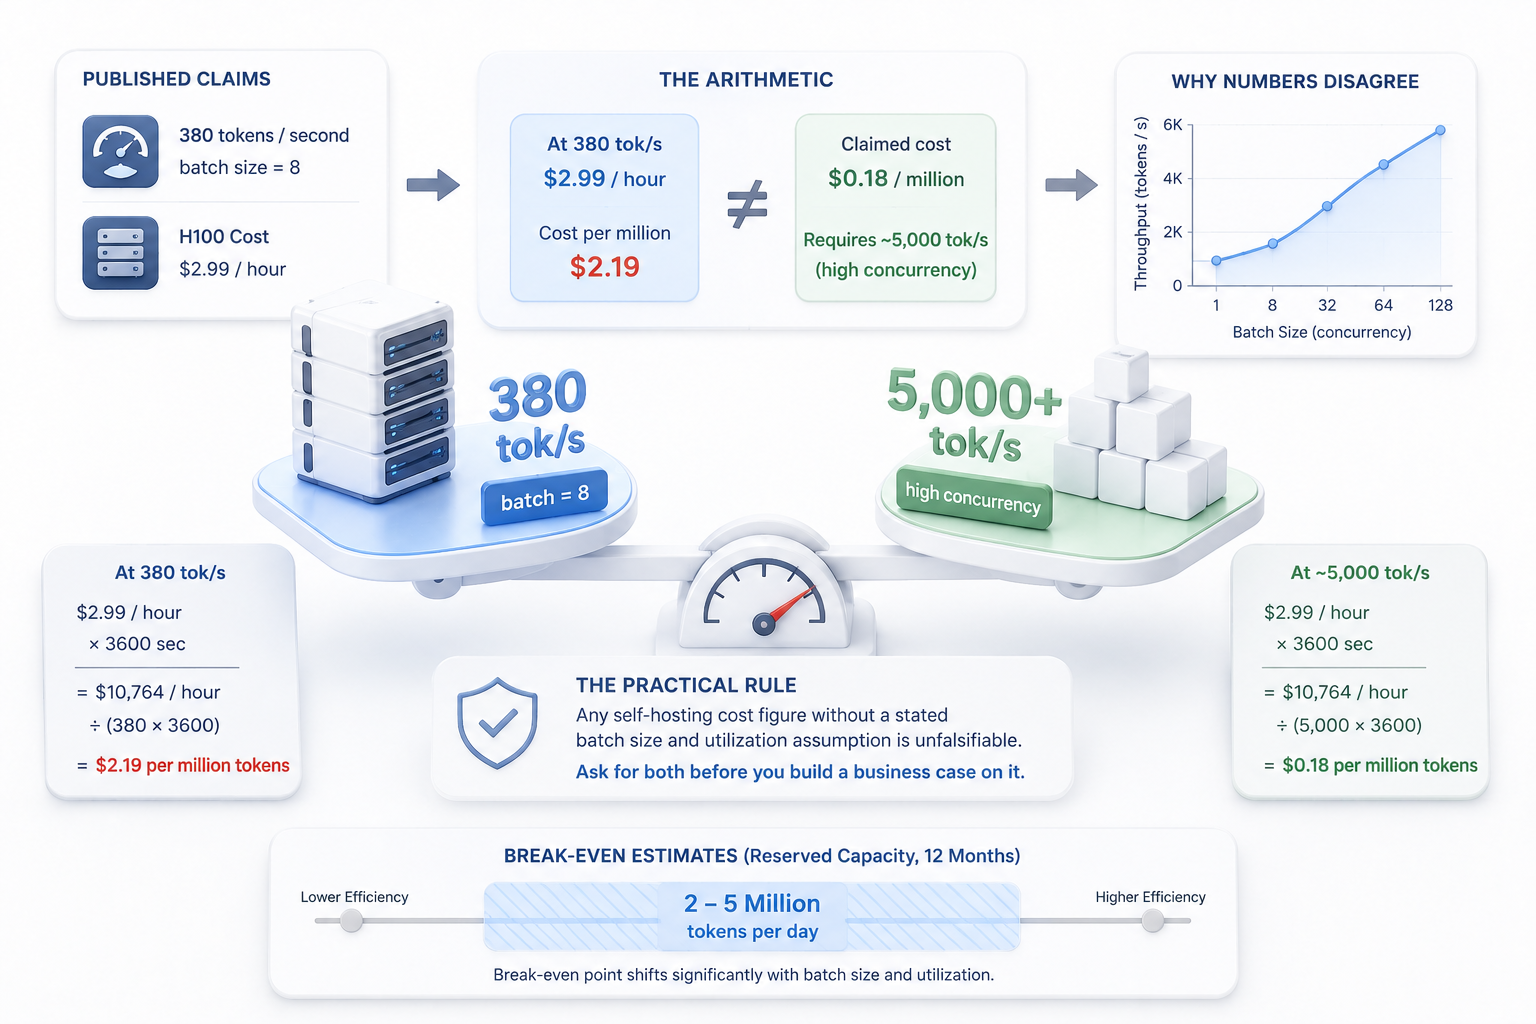
A widely cited benchmark reports self-hosted Llama 4 70B on an H100 at roughly $0.18 per million output tokens, and separately reports 380 tokens per second at batch size 8.
Those two claims are not compatible. At 380 tok/s and $2.99/hour, the arithmetic gives $2.19 per million — twelve times higher. Reaching $0.18 requires sustained aggregate throughput near 5,000 tokens per second, which is achievable with continuous batching at high concurrency, but is a very different operating condition from batch=8.
Both numbers may be correct in isolation. Presented together without the batch context, they produce a cost estimate an order of magnitude off.
The practical rule: any self-hosting cost figure without a stated batch size and utilization assumption is unfalsifiable. Ask for both before you build a business case on it.
This also explains the wild range in published break-even points. Estimates cluster around 2–5 million tokens per day on reserved capacity over a twelve-month window, but that figure moves substantially with the same two variables.
The utilization Problem Nobody Prices
There is a second variable that matters more than throughput, and it appears in almost no comparison.
You rent a GPU by the hour whether or not you use it.
Take an H100 capable of 3,000 tokens per second at full load, at $2.99 per hour:
Table: scroll sideways to view all columns when needed.
| Utilisation | Effective cost per million tokens |
|---|---|
| 100% | $0.28 |
| 50% | $0.55 |
| 25% | $1.11 |
| 10% | $2.77 |
At 10% utilization, self-hosting costs more per token than several managed APIs, while also requiring you to run the infrastructure.
Production traffic is not flat. It has daily peaks, weekly troughs and quiet nights. Unless you are batching offline work into the gaps, average utilization on a dedicated GPU is frequently below 30%.
This is the honest answer to “should we self-host.” Not model quality, not hourly rates — can you keep the GPU busy? If your traffic is spiky and you cannot backfill, the managed API is usually cheaper despite the visible margin, because the provider is amortising idle capacity across thousands of customers and you would be absorbing it alone.
Why Agents Break Inference Cost Per Token Models
One workload shape deserves separate treatment, because it breaks every estimate built on chat assumptions.
A chat request is one call. An agentic task is many.
An agent reasoning through a multi-step task calls the model repeatedly — once to plan, once per tool invocation, once to interpret each result, once to decide whether it is finished. Each call carries the accumulated conversation forward as input.
Two compounding effects follow, and they multiply rather than add.
Context grows with every step. Step one sends 1,000 input tokens. Step ten may send 15,000, because it carries every prior step’s output. Input token consumption grows roughly quadratically with step count, not linearly.
Reasoning tokens stack per call. If each call generates 2,000 intermediate tokens billed as output, a twelve-step task bills 24,000 output tokens for a task whose visible result is three paragraphs.
The practical consequence: a single agent run can cost more than a thousand chat completions. Teams that validated their unit economics on a chat prototype and then shipped an agent routinely see bills an order of magnitude above forecast, and the model choice was never the problem.
Three mitigations work specifically here. Cache the stable prefix — in an agent loop the system prompt and tool definitions repeat on every call, which is the ideal caching case. summarize rather than accumulate — replace full history with a compressed state object past a threshold. Route by step — planning may need a frontier model, but parsing a tool response usually does not.
Systems that generate text and systems that take actions have different cost profiles. That distinction separates a predictable request bill from one that also depends on tool calls, retries and longer-running workflows.
How Inference Cost Per Token Collapsed
The trend line matters as much as any single figure.
GPT-4-class capability cost roughly $20 per million tokens in late 2022. Equivalent performance runs near $0.40 in 2026. Analysts have noted this decline outpaced both PC compute and dotcom-era bandwidth, running at roughly 10× annually.
Three forces drove it. Hardware improved — H100 cloud rates fell 64–75% from their peaks to settle around $2.85–$3.50 per hour. Serving software improved — continuous batching, speculative decoding and quantization extract far more throughput from the same silicon. And competition intensified, with open-weight providers pricing 50–90% below frontier APIs.
Two consequences follow.
Inference now dominates AI compute. Training a frontier model is a one-time event; serving it runs continuously for years. Inference accounts for roughly two-thirds of total AI compute in 2026, up from about one-third in 2023.
Cheaper tokens have not reduced GPU demand. This is Jevons paradox in action: falling per-token costs open new use cases faster than they reduce spend, so aggregate demand rises. Anyone forecasting lower GPU rates from falling token prices has the causality backwards.
Cutting Your Inference Cost Per Token
Ordered by return on effort.
Route by complexity first. Most applications send every request to their best model. A classifier that routes roughly 70% of queries to a budget tier, 20% to mid, and 10% to frontier commonly cuts spend by 80% or more with little quality impact, because the hard queries still reach the strong model.
Cache aggressively. If your system prompt is stable, cache it. A 97% reduction on the cached portion is available for a configuration change.
Batch anything asynchronous. Roughly 50% off for accepting delayed completion.
Then reduce tokens. Shorter system prompts, tighter retrieval, output length limits. This is real but slower work than the three items above.
Measure per task, not per month. A monthly total tells you what you spent. Cost per completed task tells you whether the spend is productive — and it is the only metric that survives a traffic change.
Re-verify provider prices before budgeting and record the date checked. A rate announcement may later be amended or cancelled, so an old launch announcement is not enough to price a current workload.
Primary sources
- Anthropic pricing
- OpenAI API pricing
- Google Gemini API pricing
- DeepSeek API pricing
- Cost-per-token arithmetic in this article is derived from the published formula and shown in full so readers can substitute their own figures.
Model pricing changes frequently. Verify rates and any promotional terms against provider pages before committing to a budget.
Frequently Asked Questions
What is the cheapest LLM API?
DeepSeek V4-Flash at $0.14 input and $0.28 output per million tokens is the cheapest widely available option as of August 2026, with cache hits far lower still. Whether it is cheapest for you depends on whether it meets your quality bar.
Why do output tokens cost more than input tokens?
Input is processed in parallel in a single pass. Output requires a separate forward pass per generated token, so it consumes far more compute per token. Multiples range from 2× to 6× depending on provider.
Is self-hosting cheaper than an API?
Only at sustained high utilization. Break-even estimates cluster around 2–5 million tokens per day on reserved capacity, but the figure swings widely with batch size and how busy you keep the GPU. Below roughly 30% utilization, managed APIs usually win.
How much do reasoning tokens add?
They are billed as output tokens and are frequently several times the visible response length. On reasoning-tier models this is the most common cause of bills exceeding estimates.
Will inference cost per token keep falling?
The trend has held at roughly 10× annually since 2022, driven by hardware, serving software and competition. Treat continuation as likely but not guaranteed, and note that falling unit costs have so far increased total spend rather than reducing it.
Keep reading
Here are the latest posts from the blog.

Agent Identity: Why AI Agents Shouldn’t Share a Service Account

Anthropic’s $518B Compute Commitment: The Obligation Behind It
HBM Pricing 2027: What Locked Contracts Fix in Your Budget
2 thoughts on “What Inference Actually Costs Per Token”