The architecture that became more expensive without becoming better
Multi-agent token cost rarely shows up in a design review. It shows up a month later on the invoice. Take a team that splits a defect-investigation agent into a planner, three specialist workers and a synthesiser. Its fix rate improves, so it scales to eight workers. The fix rate stays flat and the per-run model bill more than doubles.
Nothing went wrong with the models. Each worker reread the same code, wrote its own notes, and handed them to a synthesiser that read them all again. Per-token prices have fallen over the past year, but this system now buys far more tokens per answer. A cheaper token and a more expensive system can coexist, and that gap is the subject of this article.
Key Takeaways
- Agent count is a poor proxy for quality. In the largest controlled study available, multi-agent setups averaged −0.3% against a single agent, with results ranging from +80.8% to −70% depending on the task.
- Most extra tokens come from repeated context. In this article’s eight-agent example, workers rereading the same 20,000-token code context account for 72% of all input tokens.
- In the example, going from one to three agents cost $2.34 per additional successful task. Going from three to five cost $12.95. Going from five to eight cost $0.78 more per run with no gain.
- Token prices and GPU rental prices are separate markets. Falling API rates do not mean falling H100 rents, and the dated data does not show that they have.
- Extra agents can still pay when subtasks are genuinely independent, when a failure is expensive, or when parallel work cuts latency someone cares about.
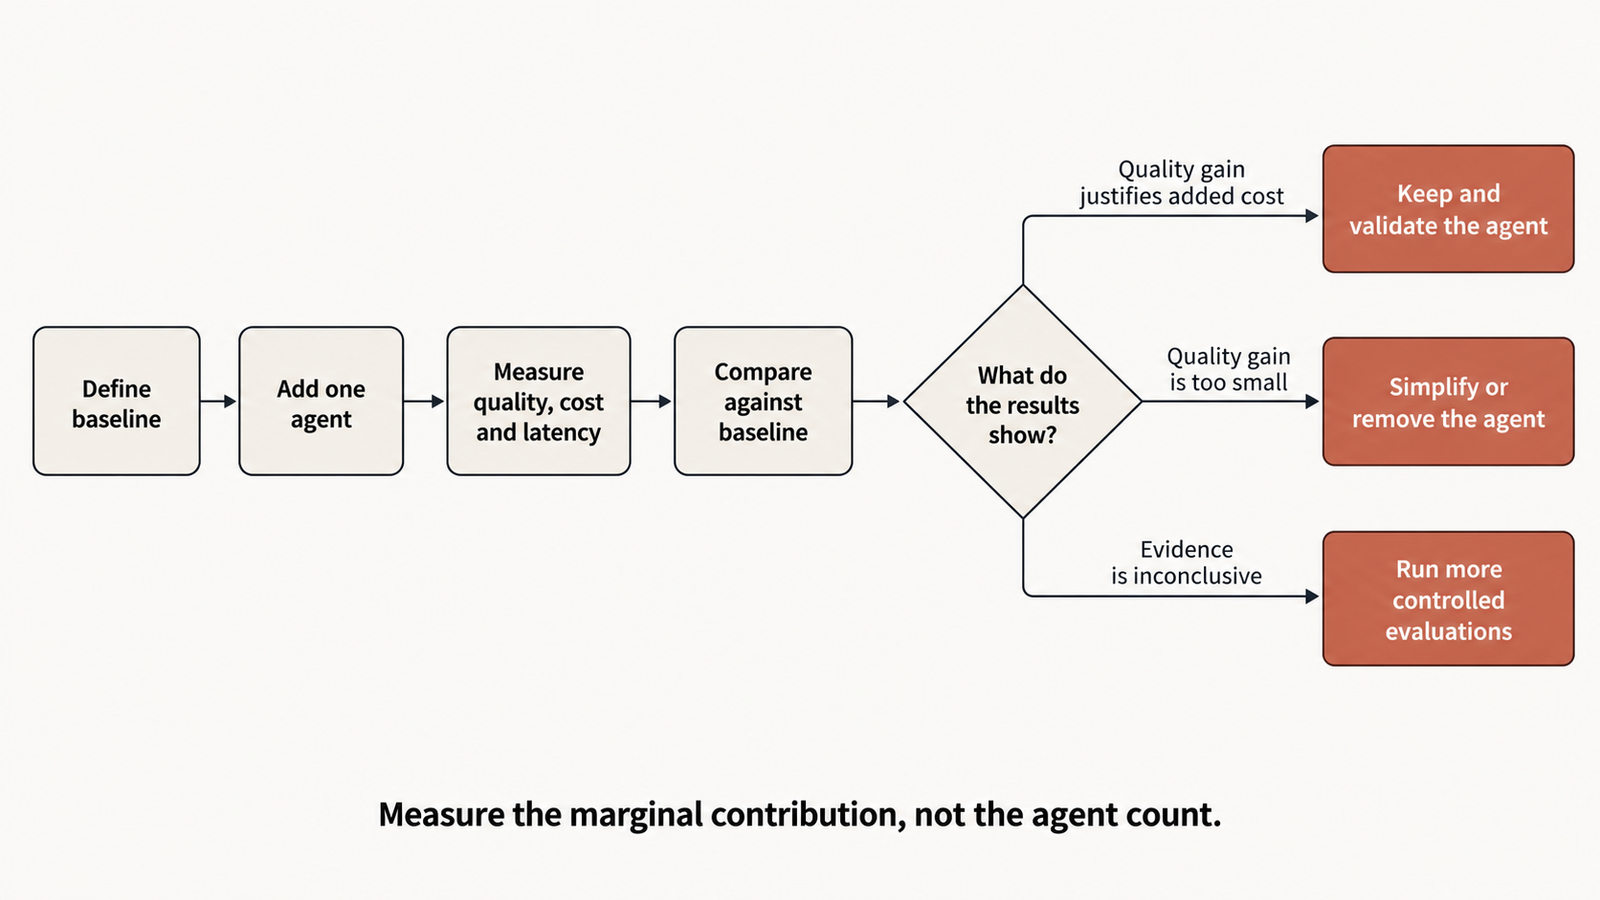
- Before adding an agent, run an ablation. Remove it, rerun the same evaluation set, and compare cost per successful task.
Quick Navigation
- The multi-agent token cost is hidden in the handoffs
- What the research on multi-agent scaling establishes
- The four-configuration multi-agent token cost test
- The point where more agents stop paying
- Why cheaper tokens do not guarantee cheaper AI systems
- A decision rule engineers can actually use
- What to measure before scaling the agent count
- Conclusion: optimise the work, not the agent count
- Frequently Asked Questions
The multi-agent token cost is hidden in the handoffs
Agents are not the unit of cost. Model calls are, and every call pays for its whole input again.
A single agent investigating a bug might make eight calls. It starts with the bug report and the relevant code, about 20,000 tokens, and appends what it learns as it goes. By the last call its input is larger, but it only ever pays for one copy of the codebase per call.
Split that work across workers and the arithmetic changes. A planner reads the task and writes assignments. Each worker then reads the same code plus its own brief, makes a few calls of its own, and writes a report. A synthesiser reads every report alongside the original context. The code that the single agent read eight times is now read four times per worker, by every worker.
That is the first cost driver: duplicated context. The second is intermediate output. Plans, reports and summaries are output tokens, billed at five times the input rate on many current models, and then billed again as input when the next agent reads them. Retries add a third layer. A worker that fails a tool call reruns with its full context.
None of this makes multi-agent design wrong. It means the useful question is how much an added worker contributes beyond the context it rebuys, not how many agents a system has. UniverseBlend found the same pattern in a different form in its analysis of why a 50% price cut doesn’t halve agent bills: in agent workloads, the line item that repeats matters more than the headline rate.
What the research on multi-agent scaling establishes
The circulating claim that agent quality plateaus while token use keeps climbing has a real basis, but not a single magic number behind it. No paper dated October 12, 2026 matching that claim could be found. The strongest primary evidence is earlier and more careful.
Kim and colleagues at Google Research, Google DeepMind and MIT tested 260 configurations in Towards a Science of Scaling Agent Systems (arXiv, version 3 dated April 8, 2026). They compared a single agent against four multi-agent designs across six agentic benchmarks, from financial analysis to SWE-bench Verified, using OpenAI, Google and Anthropic models.
The headline is variance, not improvement. Averaged across every multi-agent result, performance changed by −0.3% relative to a single agent, with a 95% interval running from −58.7% to +77.2%. A centralised design improved Finance-Agent by 80.8%. Every multi-agent design made PlanCraft worse, by 39.1% to 70.0%. On SWE-bench Verified, all variants lost ground.
Two findings bear directly on cost. First, token efficiency collapsed. A single agent produced 67.7 successes per thousand tokens; centralised and hybrid teams produced 21.5 and 13.6. Second, tasks where a single agent already scored above 45% saw negative returns from adding agents. This was the paper’s most statistically robust result (β = −0.236, p = 0.004).
The agent-count question itself was a smaller, preliminary test. Using Gemini models at 1, 3, 5, 7 and 9 agents, the authors report that Gemini 2.0 Flash peaked at seven agents before degrading, and that a centralised Gemini 2.5 Pro team showed diminishing returns beyond five. The paper does not give the exact accuracies or name the benchmark for that figure. So “quality plateaus at five agents” is too strong a summary. The defensible reading is that the optimum depends on model and coordination design, and it arrived at single-digit team sizes in the cases tested.
The study did not measure latency, and it reports dollar cost only as marginal cost per point of success for one architecture. A newer paper on vulnerability-discovery agents, Where Do the Tokens Go? (October 8, 2026), adds a consistent observation from a different domain: “higher spending does not consistently yield better outcomes.” It does not vary agent count, so it supports the spending point and nothing more.
The practical consequence is that there is no published universal agent count to copy. Each team has to measure its own curve.
The four-configuration multi-agent token cost test
What follows is a transparent cost model, not a benchmark. Token counts and success rates are illustrative assumptions chosen to be plausible and consistent with the research above. Prices are real.
- Task (same for all four): investigate a reported defect in a service and produce a root cause plus a proposed patch. Success means the patch passes the project’s existing test suite and a reviewer accepts the diagnosis.
- Model and prices: Claude Sonnet 5.5, $2.00 per million input tokens and $10.00 per million output tokens, USD, from Anthropic’s pricing page, checked October 11, 2026.
- Included: every priced model call (planner, workers, synthesiser).
- Excluded: prompt caching, retries, tool execution, embeddings, external search, orchestration servers and engineering time.
Workload assumptions:
- Shared context: 20,000 tokens (bug report plus relevant code).
- One agent: 8 sequential calls, average input 32,000 tokens (shared context plus 12,000 accumulated notes), 1,500 output tokens each.
- Multi-agent (n workers): one planner call (21,000 in / 2,000 out); each worker makes 4 calls averaging 26,000 input (shared context, brief and own notes) and 1,200 output; one synthesiser call reading the shared context, a 1,500-token report per worker and the 2,000-token plan, writing 3,000 tokens.
- Success rates (illustrative): 38%, 50%, 54% and 53%. The single-agent baseline is set below the 45% level at which Kim et al. found extra agents start to hurt. The slight drop at eight reflects the degradation they observed at larger team sizes.
Token arithmetic
- 1 agent: input 8 × 32,000 = 256,000; output 8 × 1,500 = 12,000.
- 3 agents: input 21,000 + (3 × 4 × 26,000 = 312,000) + (20,000 + 4,500 + 2,000 = 26,500) = 359,500; output 2,000 + 14,400 + 3,000 = 19,400.
- 5 agents: input 21,000 + 520,000 + 29,500 = 570,500; output 2,000 + 24,000 + 3,000 = 29,000.
- 8 agents: input 21,000 + 832,000 + 34,000 = 887,000; output 2,000 + 38,400 + 3,000 = 43,400.
Cost = input tokens ÷ 1,000,000 × $2.00 + output tokens ÷ 1,000,000 × $10.00.
Results
Table: scroll sideways to view all columns when needed.
| Metric | 1 agent | 3 agents | 5 agents | 8 agents |
|---|---|---|---|---|
| Input tokens | 256,000 | 359,500 | 570,500 | 887,000 |
| Output tokens | 12,000 | 19,400 | 29,000 | 43,400 |
| Total tokens | 268,000 | 378,900 | 599,500 | 930,400 |
| Input cost | $0.512 | $0.719 | $1.141 | $1.774 |
| Output cost | $0.120 | $0.194 | $0.290 | $0.434 |
| Total API cost per run | $0.632 | $0.913 | $1.431 | $2.208 |
| Success rate (illustrative) | 38% | 50% | 54% | 53% |
| Incremental cost vs previous | — | +$0.281 | +$0.518 | +$0.777 |
| Incremental success vs previous | — | +12 pts | +4 pts | −1 pt |
| Cost per successful task | $1.66 | $1.83 | $2.65 | $4.17 |
| Latency (estimate, 8 s per call, workers fully parallel) | ~64 s | ~48 s | ~48 s | ~48 s |
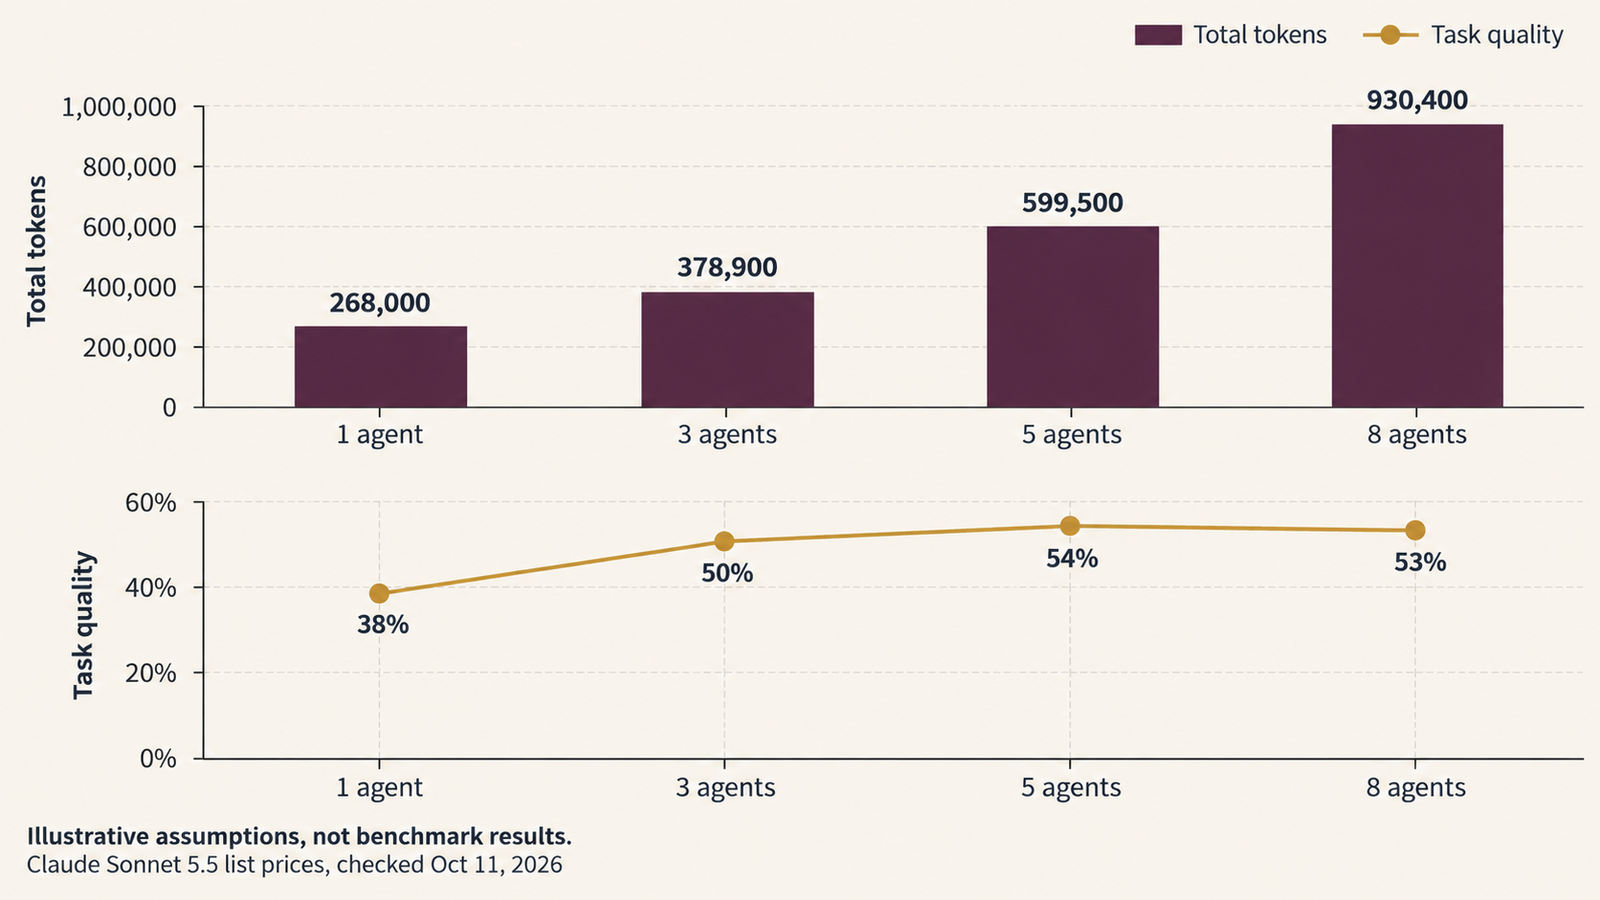
These are four different measurements. Total tokens tripled between one and five agents (268,000 to 599,500), while cost per successful task rose by 60% ($1.66 to $2.65). The ratios differ because more successes partly offset the extra spend. Latency improves when workers run in parallel, as long as the provider lets eight 26,000-token requests run at once. That depends on tokens-per-minute limits, covered in UniverseBlend’s guide to AI API rate limits in 2026. The latency figures are illustrative too.
The point where more agents stop paying
The marginal numbers carry the argument.
- One to three agents: +$0.281 per run for +12 points of success, or $0.281 ÷ 0.12 = $2.34 per additional successful task.
- Three to five: +$0.518 for +4 points = $12.95 per additional success.
- Five to eight: +$0.777 for −1 point. No additional successes, so the move never pays.
Whether $12.95 is too much depends on what a success is worth, which the token bill cannot tell you. The rule is to add the agent only if (gain in success rate) × (value of one success) is greater than the added cost per run.
If a resolved defect saves an engineer an hour, valued at $50, then 0.04 × $50 = $2.00 exceeds $0.518 and five agents beat three. If the task is low-stakes triage worth $5 per success, 0.04 × $5 = $0.20 falls short, and three agents is the right stopping point. Eight agents lose at any value, because they produce no gain.
That is the honest answer to the headline. In this example the agent stops paying for itself at the configuration where its marginal success gain, times what a success is worth, drops below its marginal tokens. The break-even depends on the value of a success, not on a universal number of agents.
Four task properties move that point.
- Independence of subtasks. Workers that split a search space with little overlap add coverage cheaply. Workers that all need the full context mostly add duplicated reading. That is the Finance-Agent pattern versus the PlanCraft pattern in Kim et al.
- Baseline strength. When a single agent already succeeds most of the time, there is little left to gain and more room for coordination errors.
- Error propagation. Kim et al. measured error amplification of 17.2× for independent agents against 4.4× for centralised designs with a verifier. More agents without a checking step multiply mistakes as well as tokens.
- Cost of failure. For security review, financial reconciliation or production incidents, a second independent opinion can be worth many times its tokens even at a small success gain.
Why cheaper tokens do not guarantee cheaper AI systems
API prices have fallen. OpenAI’s GPT-6 Sol launched at $2 input and $10 output per million tokens, half the $4 and $20 of GPT-5.6 Sol, as UniverseBlend covered in September. On the current model page, GPT-6.1 Sol still lists $2 and $10.
GPU rents have not followed. The Silicon Data H100 rental index read $2.85 per GPU-hour on October 12, 2026, up 1.1% over the previous week. SemiAnalysis has reported one-year H100 rentals rising from about $1.70 in October 2025 to about $2.35 in March 2026. That figure could not be independently opened for this article and should be treated as reported, not verified. On-demand list prices on October 10 still ran from $2.89 to $11.68 per GPU-hour depending on provider and configuration, as tracked in UniverseBlend’s GPU cloud pricing comparison.
The two prices measure different things. An API price is what a provider charges per token, after its own hardware efficiency, batching and margin. A GPU rent is what scarce hardware fetches by the hour. Better software, quantisation and newer chips can push the token price down while demand for the hardware pushes its rent up. Both can be true at once without contradicting each other.
This is where Jevons’ paradox gets invoked. William Stanley Jevons observed in The Coal Question (1865) that more efficient steam engines increased Britain’s total coal consumption, because cheaper effective energy opened new uses. The AI version says cheaper tokens unlock workloads, multi-agent systems among them, that consume so many more tokens that total compute demand rises.
The analogy needs conditions before it holds. Demand for tokens must be elastic enough that lower prices raise total spending, not just volume. The efficiency gain must be what lowered the price, not a subsidy or promotional pricing. And the measure must be total resource use, not one company’s bill. The dated evidence here shows falling list prices and stable-to-rising GPU rents. That is consistent with Jevons, but it does not prove it. Supply constraints alone could explain firm rents.
For a team running agents, the practical point is narrower. A cheaper model makes each token cheaper, but an architecture that multiplies tokens 3.5-fold, as eight agents did in the example, can absorb a 50% price cut and still cost more. If you self-host, the relevant price is the GPU-hour and your utilisation, not the API rate card.
A decision rule engineers can actually use
Add an agent only when its measured marginal contribution is worth its marginal cost:
\Delta p \times V_{\text{success}} \; > \; \Delta C_{\text{run}} + \Delta C_{\text{latency}} + \Delta C_{\text{operations}}Here Δp is the change in success rate, V is the value of one success, and the right side is the added cost per run in tokens, waiting time and operational burden.
Before adding one, check:
- Baseline quality: what does the simplest configuration achieve on a fixed evaluation set?
- Incremental success: how much does the new agent change the success rate, with confidence intervals?
- Added tokens: how many input and output tokens does it add per run, including the context it rereads?
- Marginal cost: what is the cost per additional successful task?
- Latency: does it shorten or lengthen end-to-end time at your rate limits?
- Failure severity: what does one wrong answer cost downstream?
- Evaluation reliability: is the evaluation set large enough to detect a gain this size?
- Simpler alternatives: would a better prompt, a verifier step or a stronger single model do the same?
The most useful test is an ablation. Disable one agent, rerun the same evaluation set, and compare cost per successful task. If nothing measurable changes, the agent was decoration.
What to measure before scaling the agent count
Log tokens per call, not per run, tagged with agent role, so duplicated context is visible. Track cost per successful task as the primary metric, alongside success rate, p50 and p95 latency, retries and tool-call count.
Keep offline and production numbers apart. An evaluation set measures capability on known tasks. Production traffic adds longer contexts, rate-limit queueing and failure modes the evaluation set never contained. Re-check the ablation on a production sample before committing.
Prompt caching changes the arithmetic for the duplicated-context problem specifically. If workers share an identical prefix, cache reads can cut the cost of rereading it sharply. Rerun the cost model with your actual cache-hit rate before deciding, because it can move the break-even point.
Conclusion: optimise the work, not the agent count
The evidence does not support a universal team size, and it does not support the idea that more agents are better. The largest controlled study found an average effect near zero, wide variation by task, and token efficiency falling by a factor of three or more. The worked example shows how that looks on an invoice. The first two extra agents earned their keep, the next two did so only for valuable tasks, and the last three added nothing.
Multi-agent token cost is a design variable, not a fixed tax. Split work where subtasks are genuinely independent, add verification where errors are expensive, and stop when the next agent’s marginal success, times what a success is worth, no longer covers its marginal tokens. An additional agent is justified when its measurable contribution exceeds what it costs. Nothing else about it matters.
Frequently Asked Questions
What is multi-agent token cost?
Multi-agent token cost is the total model spend of a system where several LLM agents collaborate on one task. It includes each agent’s own calls, the context every agent rereads, plans and reports passed between agents, and the final synthesis. It usually grows faster than the number of agents because shared context is paid for repeatedly.
How many agents should an AI system use?
No study supports a universal number. Kim et al. found optimal team sizes depended on the model and coordination design, with diminishing returns appearing beyond five to seven agents in their preliminary Gemini tests. Start with one agent, add one at a time, and keep each only if it improves cost per successful task.
Why do multi-agent systems consume more tokens?
Each agent rereads shared context, writes intermediate plans or reports, and passes them on to be read again. Coordination also adds turns: Kim et al. measured hybrid designs taking 44.3 turns on average against 7.2 for a single agent. Retries and synthesis calls add further tokens.
Does adding more agents improve LLM accuracy?
Sometimes. Across 260 configurations, Kim et al. found a mean change of −0.3%, with gains up to +80.8% on a financial-analysis benchmark and losses up to −70% on a planning benchmark. Tasks where a single agent already exceeded 45% accuracy tended to get worse with more agents.
How can engineers calculate cost per successful AI task?
Add up input and output token costs for every model call in a run, then divide by the run’s success rate on a fixed evaluation set. For example, $0.913 per run at 50% success is $1.83 per successful task. Compare configurations on this figure, not on raw token counts.
Does cheaper token pricing make multi-agent systems cheaper?
Only if token consumption grows more slowly than prices fall. A 50% price cut is erased by an architecture that uses 3.5 times the tokens. And for self-hosted systems, API price cuts do not lower GPU rents, which have been stable to rising in 2026.
Keep reading
Here are the latest posts from the blog.

When Adding an Agent Stops Paying for Itself

LLM Context Window Comparison 2026: Limits and Costs
LLM Inference Latency by Model and Provider: Real Numbers