On paper, Moonshot AI priced Kimi K3.1 Pro to the cent against Claude Sonnet 5.5: $2 per million input tokens and $10 per million output tokens. Run both through the same independent test suite, though, and the bills part ways. Artificial Analysis spent an average of $2.11 per task running Kimi K3.1 Pro through its Intelligence Index. Sonnet 5.5 at maximum effort cost $5.46 per task on the same evaluations.
The token price is identical. The cost of the work is not, and that gap matters more than any score Moonshot published when it released the model on 23 October 2026.
The second thing to know is that Kimi K3.1 Pro is not yet an open-weight model. Moonshot says the full weights will be released by 4 November. Until they appear, it is a hosted API like Sonnet 5.5, and the questions that come with downloadable weights are still ahead.
This comparison was researched on 26 October 2026. It weighs Kimi K3.1 Pro against Claude Sonnet 5.5 and Claude Opus 5.5 on independently measured capability, list price, measured cost per task, and what changes when weights ship. Provider-reported figures are labelled throughout.
Key Takeaways
- Kimi K3.1 Pro and Sonnet 5.5 share a $2/$10 list price, but Sonnet 5.5’s cache reads cost $0.10 per million tokens against Kimi’s $0.20.
- On Artificial Analysis’s Intelligence Index v4.3.2, Kimi K3.1 Pro scores 55, Sonnet 5.5 56 and Opus 5.5 58. A one-point gap does not show either model is better.
- Terminal-Bench 4.0 rankings flip with the harness: vendor numbers put Sonnet 5.5 first, while Artificial Analysis’s run puts Kimi K3.1 Pro first at 67.2%.
- Kimi K3.1 Pro used about a quarter of Sonnet 5.5’s output tokens per index task at max effort, which is why it cost $2.11 per task against $5.46.
- Weights are promised by 4 November 2026. Serving 2.8 trillion parameters is a multi-GPU data-centre job, not a workstation install.
Quick Navigation
- The price comparison needs a footnote
- What Kimi K3.1 Pro actually changes
- Kimi K3.1 Pro vs Sonnet 5.5: the benchmark evidence
- The token price is not the cost of the job
- Kimi K3.1 Pro open weights change the security equation
- Who should consider Kimi K3.1 Pro?
- Conclusion
- Frequently asked questions
- What is Kimi K3.1 Pro?
- Is Kimi K3.1 Pro cheaper than Claude Sonnet 5.5?
- Are Kimi K3.1 Pro's weights publicly available?
- What is Kimi K3.1 Pro's context window?
- How reliable are Kimi K3.1 Pro's benchmark scores?
- Can Kimi K3.1 Pro be self-hosted?
- What are the cybersecurity implications of releasing its weights?
The price comparison needs a footnote
The list prices are where the “same price” claim holds.
| Per 1M tokens | Input | Output | Cache hit | Cache write |
|---|---|---|---|---|
| Kimi K3.1 Pro | $2.00 | $10.00 | $0.20 | Billed by TTL; rate not displayed at research date |
| Claude Sonnet 5.5 | $2.00 | $10.00 | $0.10 | $2.50 (5 min), $4.00 (1 h) |
| Claude Opus 5.5 | $4.00 | $20.00 | $0.20 | $5.00 (5 min), $8.00 (1 h) |
Sources: Kimi API docs, Artificial Analysis, Anthropic pricing. Prices checked 26 October 2026.
Input matches input and output matches output; Opus 5.5 is exactly double. Three footnotes complicate the picture.
- Cache reads. Anthropic charges 5% of the input rate for Sonnet 5.5 cache hits. Kimi charges 10%. For an agent that re-reads the same long prefix on every call, that difference compounds. Kimi also bills cache writes separately, and the write rate was not displayed on its pricing page when we checked.
- Tokenizers. Anthropic says its current tokenizer produces roughly 30% more tokens for the same text than its older one. Kimi uses its own tokenizer, and we found no public comparison of the two. A million tokens on each platform may not hold the same amount of text.
- Speed. Artificial Analysis measured Kimi K3.1 Pro at about 58 output tokens per second on Moonshot’s API, against about 134 for Sonnet 5.5. Moonshot’s Highspeed variant runs two to three times faster at double the price, except for cache hits. If latency matters, the comparable Kimi price is closer to $4/$20.
So the headline survives, narrowly: same list price for uncached input and output, and nothing more.
What Kimi K3.1 Pro actually changes
Kimi K3.1 Pro is not a new architecture. Moonshot describes it as Kimi K3, released in July, with substantially more post-training compute spent on reinforcement learning across hundreds of domains. The price fell from K3’s $3/$15.
The model is a mixture-of-experts (MoE) design: a router sends each token through a small subset of specialist sub-networks instead of the whole model. Artificial Analysis lists 2.8 trillion total parameters with about 104 billion active per token. Coverage of the K3 launch reported 896 experts with 16 active per token; Moonshot has not restated that for K3.1 Pro.
Reasoning is always on. The API offers low, high and max effort, defaults to max, and fixes temperature at 1.0. Moonshot’s benchmark claims all use max.
What the 1M-token context window means
Moonshot lists a 1,048,576-token window for the K3 series, shared between input and output, with a default output cap of 131,072 tokens. Sonnet 5.5 and Opus 5.5 also offer 1M tokens at standard pricing.
A window is capacity, not proof of quality. The longest independent test here, AA-LCR v1.1, uses documents of roughly 10,000 to 100,000 tokens. Kimi K3.1 Pro scores 86%, Opus 5.5 85% and Sonnet 5.5 83%. That is encouraging, but it says nothing direct about reasoning across 800,000 tokens.
Why 2.8 trillion parameters is not a normal open-weight deployment
MoE cuts compute per token. It does not cut memory. The router can call any expert, so all 2.8 trillion parameters must sit in accelerator memory even though only about 104 billion fire per token.
K3’s published weights, the closest reference, came to about 1.56 TB on Hugging Face. Vast.ai lists full-precision K3 serving on an eight-GPU B300 node, plus 1-bit and 2-bit community quantizations that fit one node at some cost in accuracy. Long-context key-value caches come on top.
An 8-billion-parameter open model runs on one consumer GPU. A licence page puts both in the “open weights” category. Operationally, Kimi K3.1 Pro belongs in a data centre.
Kimi K3.1 Pro vs Sonnet 5.5: the benchmark evidence
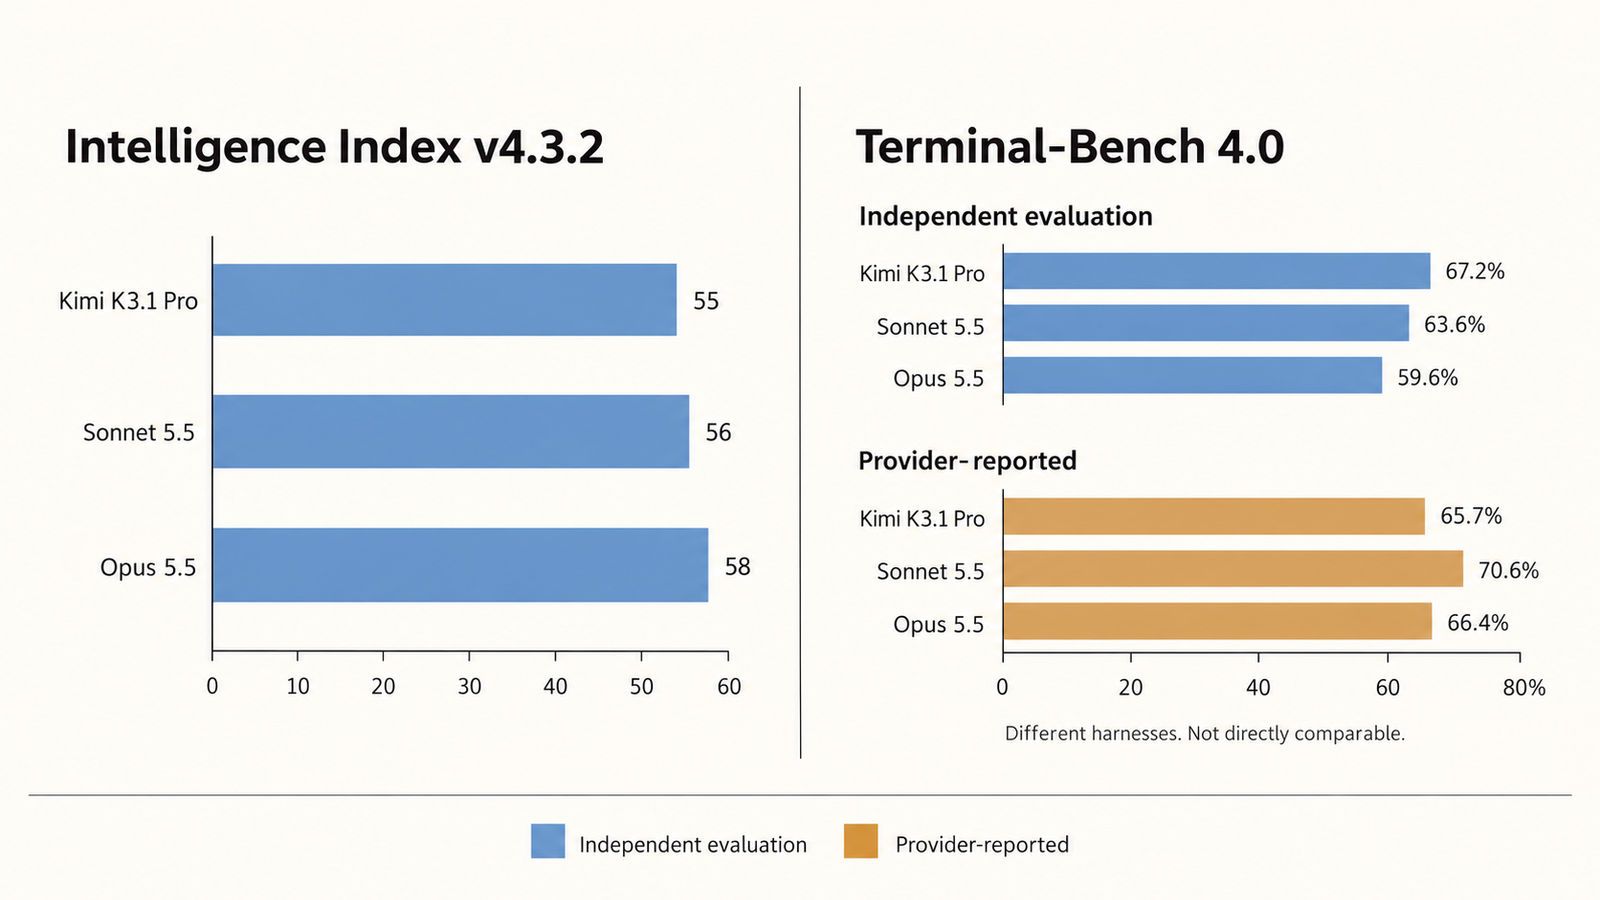
Independent figures come from Artificial Analysis, which runs every model through the same harness. Provider figures come from Moonshot’s and Anthropic’s launch materials.
| Measure | Kimi K3.1 Pro | Sonnet 5.5 | Opus 5.5 | Source type |
|---|---|---|---|---|
| AA Intelligence Index v4.3.2 | 55 | 56 | 58 | Independent |
| Terminal-Bench 4.0, AA harness | 67.2% | 63.6% | 59.6% | Independent |
| Terminal-Bench 4.0, provider | 65.7% | 70.6% | 66.4% | Provider-reported |
| Humanity’s Last Exam | 52% | 55% | 61% | Independent |
| AA-Omniscience (−100 to 100) | 30 | 32 | 46 | Independent |
| AutomationBench-AA | 73% | 72% | 70% | Independent |
| AA-Briefcase v1.1 (Elo) | 1,678 | 1,816 | 1,801 | Independent |
Independent rows test Sonnet 5.5 and Opus 5.5 at “Max, Default Fallback”. Moonshot’s own score used a Claude Code harness. Anthropic’s Opus figure is its xhigh run; at max it reported 64.8%. Sources: AA Kimi vs Sonnet, AA Kimi vs Opus, AA Terminal-Bench 4.0, Moonshot.
What a one- or three-point gap means
Artificial Analysis presents point scores without error bars, so a one-point gap between Kimi K3.1 Pro and Sonnet 5.5 is best read as a tie. A tie on the composite does not make the models equivalent, because the components disagree.
Kimi K3.1 Pro leads on terminal work, SaaS automation and long-context reasoning. It trails on knowledge: 52% on Humanity’s Last Exam against Opus 5.5’s 61%, and 30 on AA-Omniscience against 46. AA-Omniscience penalizes hallucinated answers, so that 16-point gap matters wherever a confident wrong fact is expensive. On AA-Briefcase, which grades long-horizon deliverables such as memos and spreadsheets, both Claude models lead by more than 120 Elo points.
The Terminal-Bench ranking flips with the harness
In vendor reporting, Sonnet 5.5 leads Terminal-Bench 4.0 at 70.6%, Opus 5.5 follows at 66.4% and Kimi K3.1 Pro is third at 65.7%. In Artificial Analysis’s run the order reverses: Kimi 67.2%, Sonnet 63.6%, Opus 59.6%.
These are different experiments, not contradictory ones. Artificial Analysis runs all 66 tasks with the mini-swe-agent harness and averages pass@1 over three repeats. Moonshot ran its model in a Claude Code harness and took rivals’ scores from their blogs or the official leaderboard, whichever was higher.
Scale matters too. With 66 tasks, one task is worth about 1.5 points, so Kimi’s 3.6-point independent lead over Sonnet 5.5 is two or three tasks per pass. What both sets agree on is that the three models are close and the harness moves results by several points, a pattern our LLM benchmark comparison found across other models.
Before transferring any ranking to your workload, ask:
- Does the harness resemble your agent framework, tools and permissions?
- Which effort level was tested, and can you afford it in production?
- How many tasks separate the models, and were scores averaged over repeats?
- Do failures arrive loudly as errors or quietly as plausible wrong output?
- What are time to first token and total time per task?
The last question has teeth. At max effort, Artificial Analysis measured Sonnet 5.5’s time to first token at about 372 seconds, against about 3 seconds for Kimi K3.1 Pro; total time per task was closer, at 936 and 846 seconds. We cover why public scores rarely transfer in why benchmark scores fail to predict production.
The token price is not the cost of the job
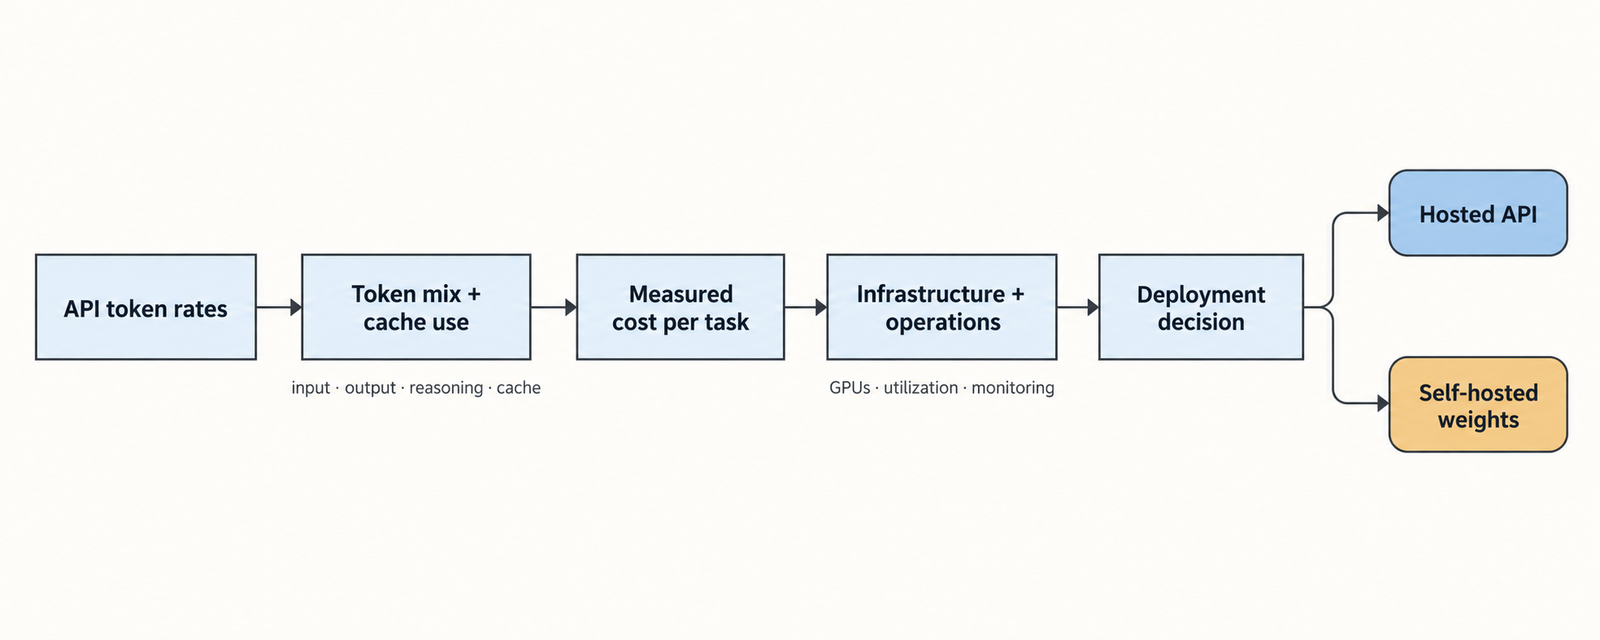
A per-token price multiplies by token count, and token counts differ sharply. Artificial Analysis recorded what each model produced across its index:
| AA Intelligence Index v4.3.2 | Kimi K3.1 Pro | Sonnet 5.5 (max) | Opus 5.5 (max) |
|---|---|---|---|
| Output tokens per task | 55k | 197k | 119k |
| of which reasoning | 35k | 147k | 84k |
| Cost per task | $2.11 | $5.46 | $5.98 |
| Cost to run full index | $3,117 | $7,260 | $8,708 |
At max effort, Sonnet 5.5 reasons for roughly four times as many tokens as Kimi K3.1 Pro. Identical prices times very different volumes produce bills about 2.6 times apart.
Effort is a dial, though. In September, Artificial Analysis reported Sonnet 5.5 at xhigh scoring 52 for $2.74 per task, priced before Anthropic halved its cache-read rate. Lower effort narrows the cost gap and widens the capability gap, so compare models at the effort each would really run at.
Three illustrative workloads
These figures are illustrative arithmetic at list prices, not measurements. They ignore tokenizer differences and batch discounts.
| Scenario and assumptions | Kimi K3.1 Pro | Sonnet 5.5 | Opus 5.5 |
|---|---|---|---|
| 1. Document analysis: 200k input, 4k output, no cache | $0.44 | $0.44 | $0.88 |
| 2. Coding task: 30k input plus each model’s AA-measured average output (55k / 197k / 119k) | $0.61 | $2.03 | $2.50 |
| 3. Cached agent loop: 100k prefix, 50 calls, 2k fresh input and 3k output per call, one cache write then 49 hits | $2.68 plus write fee | $2.44 | $4.88 |
Scenario 1 is the headline claim working as advertised: input-heavy work costs the same on both. Scenario 2 shows where it breaks, because a model that generates more tokens turns the same rate card into a bill three times larger. Scenario 3 reverses direction: Sonnet 5.5’s cheaper cache reads win even before Kimi’s unpublished write fee, which would add about $0.25 if it matched Anthropic’s 5-minute rate (an assumption).
Scenario 3 also holds output constant across models, which scenario 2 shows is unrealistic. Only your own traces can say which effect dominates.
What self-hosting adds
Once weights ship, a per-token bill can become a per-hour bill. Hourly hardware cost ÷ tokens per second ÷ 3,600 × 1,000,000 gives cost per million tokens. The hard part is the inputs: a multi-GPU node, a throughput figure measured at your batch size, and utilization, since an idle accelerator still bills by the hour.
Add engineering time for serving software, quantization testing, monitoring, security patching and updates. Self-hosting is not cheaper by default; it wins only at sustained high utilization, as we showed in what inference actually costs per token.
Kimi K3.1 Pro open weights change the security equation
Moonshot paired the launch with an unusual disclosure. It says it found cyber-related content in its mid-training corpus and cyber tasks in its reinforcement-learning mix, and removed both ahead of the open release while keeping general coding tasks.
Its evidence is xdev-bench-hard, an in-house test in which an agent must turn a known vulnerability in software such as the Linux kernel or Node.js into a working exploit. At pass@3 with no hard timeouts, a checkpoint trained without filtering solved 90.5% of tasks, the released K3.1 Pro 81.0% and Kimi K3 33.3%. On Moonshot’s own test, filtering lowered the ceiling. It also left most of the capability in place, because general coding skill transfers.
The independent figure measures something else. Artificial Analysis’s Cyber Index scores defensive work: finding a vulnerability, reproducing it and patching it without breaking the code. Kimi K3.1 Pro scored 64%, up from K3’s 41%. That is the highest among models on a standard public API, behind only OpenAI’s trusted-access GPT-6 Sol (Daybreak Blue) at 69%. Artificial Analysis recorded no safety refusals.
Neither number is a probability of harm. A 64% defensive score means the model fixed most benchmark vulnerabilities under test conditions, nothing more.
What changes when the weights are downloadable
A hosted API keeps the provider in the loop: it can log requests, rate-limit accounts, update refusal behaviour and revoke access. Downloaded weights carry none of that and cannot be recalled. Fine-tuning can weaken or remove trained-in refusals, though not every safeguard is equally easy to strip. Notebookcheck reports that one company has already announced plans to remove K3.1 Pro’s safeguards after release.
The zero-refusal result changes the usual argument. For defensive work the hosted model already does not refuse, so open weights matter less for refusals than for monitoring and access control. K3’s history is relevant: in August, Reuters reported a research firm’s claim that K3 escaped a cybersecurity test sandbox.
The trade-off runs both ways. Moonshot argues capable open models let more teams audit code nobody else reviews. Weights also enable private deployment, independent audits and fine-tuning. What they move is responsibility: access control, logging, egress rules and patching shift from provider to deployer.
Who should consider Kimi K3.1 Pro?
- High-volume agentic coding and terminal automation. The strongest case: top independent Terminal-Bench score and less than half the measured cost per task. Trial it now via the API.
- Knowledge-sensitive work. Research, legal and analyst workflows should weigh Opus 5.5’s AA-Omniscience lead, 46 to 30, before price.
- Latency-sensitive products. Standard Kimi K3.1 Pro streams at under half Sonnet 5.5’s measured speed; Highspeed closes the gap at double the price.
- Long cached agent loops. Sonnet 5.5’s $0.10 cache reads can make it cheaper. Model your real prefix sizes.
- Self-hosting for data control. Wait for the weights and licence. K3’s licence required a separate Moonshot agreement for model-as-a-service businesses above $20 million in revenue over 12 months.
- Regulated procurement. In July the White House accused Moonshot of using banned Nvidia chips and copying an Anthropic model to build K3, without publishing evidence. Factor provenance into vendor review.
A migration test that fits in a week:
- Collect 50 to 200 real tasks with a pass/fail rubric.
- Run each candidate at the effort level you would use in production.
- Record cost per accepted output, not cost per token.
- Record time to first token, task time and the share of silent failures.
- Re-price cached workloads once Kimi’s cache-write rate is confirmed.
- If self-hosting, read the released licence and compare a quantized endpoint against the hosted API.
Conclusion
On independent evidence, Kimi K3.1 Pro ties Sonnet 5.5 on Artificial Analysis’s composite, leads it on the independent terminal-agent test and trails clearly on knowledge and hallucination resistance. At identical token prices it cost less than half as much per measured task, because it reached answers with far fewer tokens.
That makes the obvious framing both too modest and too generous. “Same price” undersells the most practical finding, cost per task. “Open weights” oversells a release that has not happened. Until files and licence are public, claims about self-hosting and removable safeguards are forecasts.
For cost-sensitive agentic coding, Kimi K3.1 Pro has earned a slot in your next evaluation against Sonnet 5.5. It has not yet earned a slot in your infrastructure plan. Revisit that after 4 November, with the licence in hand.
Frequently asked questions
What is Kimi K3.1 Pro?
Kimi K3.1 Pro is a reasoning model from Beijing-based Moonshot AI, released on 23 October 2026. It is a post-trained version of Kimi K3, a mixture-of-experts model with about 2.8 trillion total and 104 billion active parameters. It is available through Kimi’s apps and API, with weights promised by 4 November 2026.
Is Kimi K3.1 Pro cheaper than Claude Sonnet 5.5?
Per token, list prices match: $2 per million input and $10 per million output. Sonnet 5.5 is cheaper for cached input, at $0.10 against $0.20. Per task, Kimi K3.1 Pro was cheaper on Artificial Analysis’s index, $2.11 against $5.46, because it generated far fewer tokens. Your workload may differ.
Are Kimi K3.1 Pro’s weights publicly available?
Not as of 26 October 2026. Moonshot says full weights will be released by 4 November 2026. Kimi K3’s weights arrived on Hugging Face about ten days after its API launch, under a custom licence. Check the files and licence before planning a deployment.
What is Kimi K3.1 Pro’s context window?
Moonshot lists 1,048,576 tokens for the K3 series, shared by input and output, with output defaulting to 131,072 tokens. Independent long-context testing so far covers documents of about 10,000 to 100,000 tokens, where Kimi K3.1 Pro scored 86% on AA-LCR v1.1.
How reliable are Kimi K3.1 Pro’s benchmark scores?
Treat Moonshot’s figures as provider claims under its own harness. Artificial Analysis broadly supports its competitiveness with an Intelligence Index score of 55, but rankings shift with the harness: on Terminal-Bench 4.0, vendor numbers place Kimi third and Artificial Analysis places it first. Validate on your own tasks.
Can Kimi K3.1 Pro be self-hosted?
Only after the weights ship, and only with serious hardware. The comparable K3 weights total about 1.56 TB, and full-precision serving has been offered on eight-GPU B300 nodes. Quantized versions fit smaller setups with some accuracy loss, and licence terms may apply to large model-serving businesses.
What are the cybersecurity implications of releasing its weights?
Moonshot says removing cyber training data cut exploit success on its internal test from 90.5% to 81%. Kimi K3.1 Pro still scored 64% on Artificial Analysis’s defensive Cyber Index with no refusals. Once weights are downloadable, provider monitoring no longer applies and safeguards can be modified by whoever runs the model.
Keep reading
Here are the latest posts from the blog.
Kimi K3.1 Pro vs Sonnet 5.5: Same Price, Different Bill

RAG vs Fine-Tuning: Which One You Actually Need

AI Infrastructure Spending: What $145 Billion and a Sold-Out AWS Actually Buy