Last updated: 3 November 2026. This page is updated monthly; each figure keeps its original publication date.
Agent traffic at one healthcare booking platform rose nearly 30-fold in three months. In one large sample of agents, 76% hadn’t run in two months but still had working credentials. Only about one company in five says it has a mature model for governing them. Taken together, these agentic AI statistics describe a technology moving into production faster than the controls around it.
This report collects 30 numbers published by 4 November 2026, each with its source, date, evidence type and limits. It covers the agent end of the wider generative AI statistics 2026 picture. Five figures come from Menlo Ventures, six from Jellyfish and five from Deloitte, so this is not 30 independent studies.
Key Takeaways
- Menlo estimates enterprise AI deployment spending at $176.8 billion, and actual spending ran well ahead of plans.
- Agent traffic is rising steeply on several platforms, but each measures it differently.
- Agents are involved in about 28% of merged PRs at the median Jellyfish customer, yet 79% of surveyed leaders see no faster releases.
- 76% of examined agents were dormant with live credentials, making agent identity a security priority.
- Only 21% of companies report mature agent governance, and 49% of AI-using workers use unapproved tools.
- Frontier models lead open-weights models by 12 points on the newest index, and by 26 points among models with released weights.
- These agentic AI statistics lean on a few vendors. Check the evidence label before quoting any number.
Quick Navigation
- The 2026 agentic AI statistics at a glance
- Agentic AI statistics on spending and economics
- Agentic AI statistics on adoption and production
- Agentic AI statistics on productivity and engineering
- Agentic AI statistics on security and risk
- Agentic AI statistics on governance
- Agentic AI statistics on models and infrastructure
- What these agentic AI statistics reveal together
- What businesses should measure next
- How these agentic AI statistics were verified
- Frequently asked questions
The 2026 agentic AI statistics at a glance
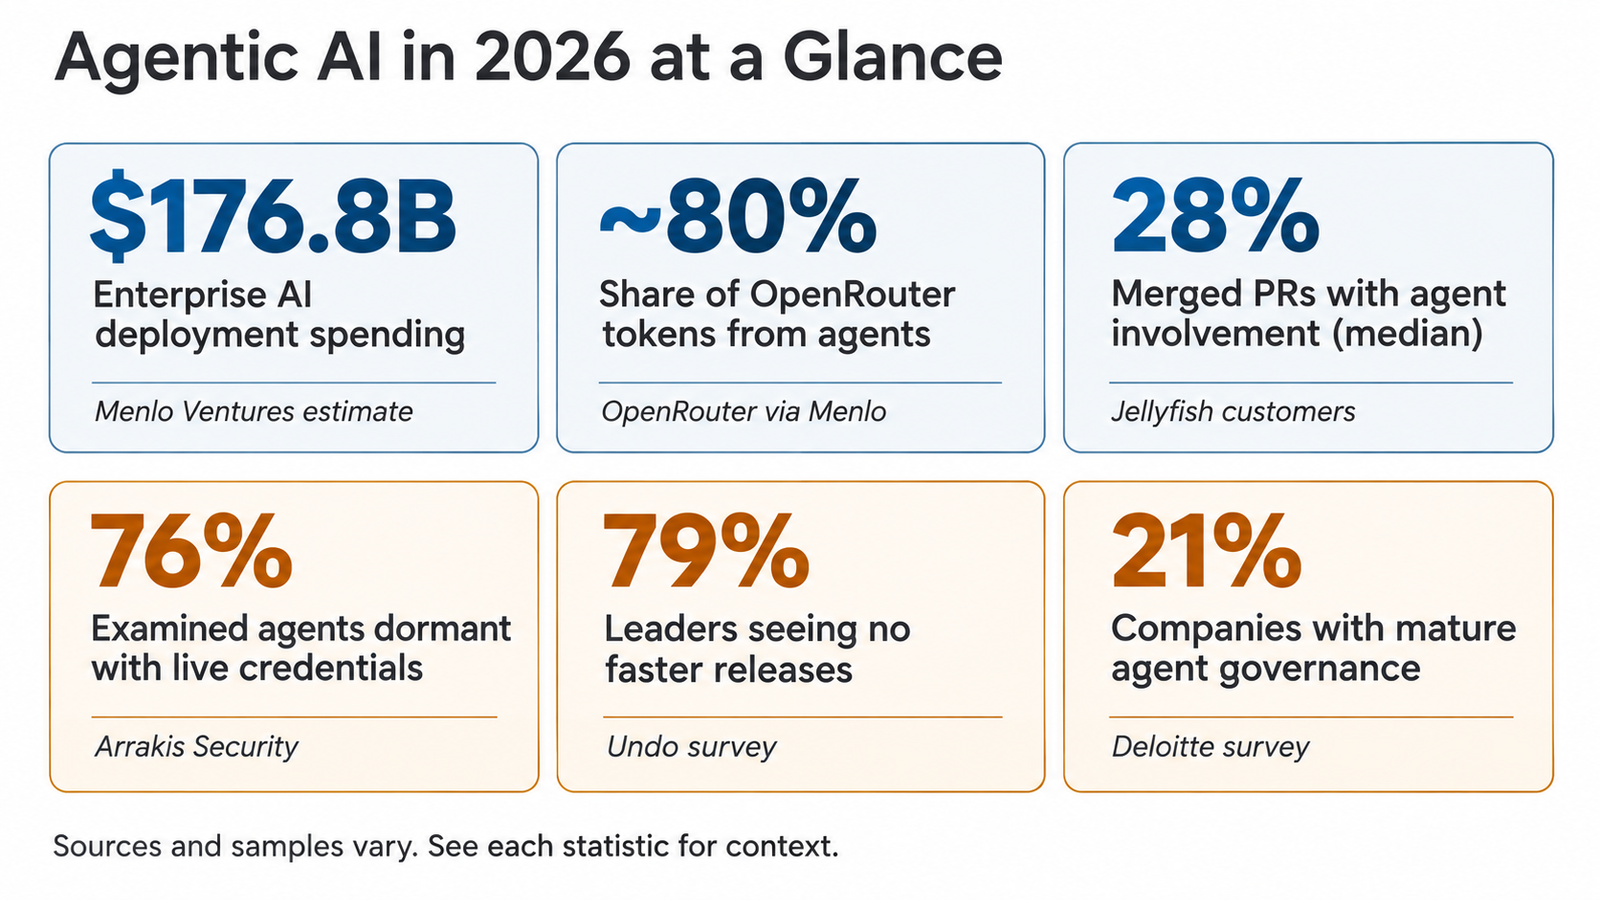
Table: scroll sideways to view all columns when needed.
| # | Statistic | Source | Evidence type |
|---|---|---|---|
| 1 | $176.8B enterprise AI deployment spending | Menlo Ventures | Industry estimate |
| 2 | 4.7x actual vs 1.9x planned average AI spend growth | Menlo Ventures | Survey |
| 6 | Nearly 30x AI agent traffic since July | Zocdoc | Company-reported |
| 8 | Agents generate ~80% of OpenRouter tokens | Menlo / OpenRouter | Platform telemetry |
| 11 | 28% of merged PRs had agent involvement (median company) | Jellyfish | Vendor telemetry |
| 13 | 81% of engineering leaders report an AI-linked incident | Undo | Vendor survey |
| 16 | 76% of examined agents dormant with live credentials | Arrakis Security | Vendor telemetry |
| 19 | 84% of disrupted ransomware victims saw AI exploited | Semperis | Vendor survey |
| 22 | 21% of companies have mature agent governance | Deloitte | Independent survey |
| 26 | 12-point gap, best closed vs best open-weights model | Artificial Analysis | Benchmark |
Agentic AI statistics on spending and economics
1. Enterprise AI deployment spending $176.8 billion
- What it says: Menlo estimates enterprise AI deployment spending reached a $176.8 billion annual run rate by September 2026, up 5.4x from a restated $33 billion.
- Source: Menlo Ventures, 2026 State of Enterprise AI, 3 November 2026 · Industry estimate
- Why it matters: AI is now a major budget line. Our analysis of the Menlo report explains why agents push it up.
- Context: All AI deployment, not agent-specific. Based on a survey of nearly 400 US decision-makers plus filings. Menlo invests in Anthropic and OpenRouter.
2. Spending outran plans 4.7x vs 1.9x
- What it says: Average enterprise AI spending reached 4.7 times the previous year against a planned 1.9 times, roughly 2.5 times the plan.
- Source: Menlo Ventures, as above · Survey
- Why it matters: Consumption-priced AI is hard to forecast with seat-based budgets.
- Context: The median was 2.2x against 1.8x planned, so heavy spenders pull the average up. Not every company overspent.
3. Spending on Anthropic-powered coding tools 10x since January
- What it says: Jellyfish data shows spending on Anthropic-powered coding tools grew tenfold since the start of 2026, reaching about 2% of total engineering cost.
- Source: TechCrunch, reporting Jellyfish data, 28 October 2026 · Vendor data, secondary report
- Why it matters: Jellyfish’s chief scientist called it “growth that most CFOs didn’t plan for.”
- Context: TechCrunch cites 276,000 Jellyfish customers; Jellyfish’s own October page lists 294,000 engineers. Engineering cost includes salaries.
4. Spend per engineer, with flat headcount 3.8x
- What it says: At the median Jellyfish customer, AI spend per engineer rose 3.8x from Q1 to Q3 2026, while headcount ended at 98% of its Q1 level.
- Source: Jellyfish, AI Engineering Trends, October 2026 · Vendor telemetry
- Why it matters: Companies are paying more for AI without yet shrinking or growing teams to match.
- Context: Covers 1,300+ Jellyfish customer companies. The data is observational.
5. Cost per pull request $1,202 → $820
- What it says: Median cost per merged pull request fell by about a third over the past year, with AI’s direct share about $18 of a $799 average.
- Source: Jellyfish, AI Engineering Trends · Vendor telemetry
- Why it matters: It’s one of the few published unit-cost measures that combine AI and labour.
- Context: Salary plus priced AI usage, divided by merged human-opened PRs. A PR isn’t a unit of delivered value.
Analysis. The money is arriving faster than plans. Spend per engineer rising almost fourfold with flat headcount suggests AI is being added on top of teams rather than replacing them, though the unit-cost evidence comes from one vendor’s customers.
Agentic AI statistics on adoption and production
6. Agent traffic to a booking platform Nearly 30x
- What it says: Zocdoc says AI agent traffic grew nearly 30-fold since July 2026, roughly doubling every 10 days from early September.
- Source: Zocdoc announcement, 28 October 2026 · Company-reported
- Why it matters: Consumer-facing agents are starting to transact rather than browse.
- Context: “Traffic” and “agent” aren’t defined, the base was small, and the figure came with Zocdoc’s own launch for agents.
7. Agentic traffic, per AMD’s chief executive More than 14x
- What it says: Lisa Su said at the OCP Global Summit that “agentic traffic has grown >14x just this year.”
- Source: DQIndia report of the keynote, 22 October 2026 · Executive statement
- Why it matters: Chipmakers are planning capacity around agent workloads.
- Context: Neither the metric (requests, tokens or sessions) nor the data source was stated.
8. Agents overtake humans on OpenRouter ~80% of tokens
- What it says: Agent traffic overtook human traffic on OpenRouter in February 2026. Since then, agent tokens grew 37x and human-driven tokens 5x. Agents now produce about 80% of tokens, about 130.9 trillion a week.
- Source: Menlo Ventures, using OpenRouter data · Platform telemetry
- Why it matters: It’s the largest public measure of agents versus people using models.
- Context: One gateway, skewed towards developers and startups; a Menlo portfolio company.
9. Plans to deploy agents Close to 75%
- What it says: Close to three-quarters of companies plan to deploy agentic AI within two years.
- Source: Deloitte, State of AI in the Enterprise 2026, 21 January 2026 · Independent survey
- Why it matters: Intent is near-universal among large companies.
- Context: 3,235 business and IT leaders in 24 countries, surveyed August to September 2025. Plans, not current deployment.
10. Pilots into production 25%
- What it says: Only 25% of respondents have moved 40% or more of their AI pilots into production.
- Source: Deloitte, as above · Independent survey
- Why it matters: It’s the bottleneck between enthusiasm and impact.
- Context: It covers AI pilots generally, not agents alone.
Analysis. These agentic AI statistics on traffic are steep but measured on different platforms with different definitions. The most rigorous survey shows plans far ahead of production, so read the multiples as early adoption on low bases.
Agentic AI statistics on productivity and engineering
11. Agent involvement in merged code 28% (median), 58% (leaders)
- What it says: At the median Jellyfish customer, 28% of merged pull requests had agent involvement, rising to 58% at leading companies.
- Source: Jellyfish, AI Engineering Trends · Vendor telemetry
- Why it matters: Agents are now part of routine code delivery.
- Context: “Involvement” isn’t authorship, and it covers Jellyfish customers only.
12. Tokens and output 10x tokens → 2.2x PRs
- What it says: Ten times more tokens in a week was associated with about 2.2 times more merged PRs.
- Source: Jellyfish, AI Engineering Trends · Vendor telemetry
- Why it matters: Returns diminish quickly. Spending more on tokens doesn’t scale output linearly.
- Context: Correlational, as Jellyfish notes.
13. Production incidents linked to AI coding 81%
- What it says: 81% of engineering leaders say their organisation had a production incident or outage linked to AI coding tools in the past six months.
- Source: Undo survey, reported by LeadDev, 12 October 2026 · Vendor survey
- Why it matters: Faster code generation is creating new failure modes downstream. Our look at who pays for coding agents’ tokens covers the review costs.
- Context: 300 senior leaders at large US and UK companies, July to August 2026. Attribution is self-reported; Undo sells debugging tools.
14. Release speed 79%
- What it says: 79% of the same leaders say release cycles are no faster than before AI tools.
- Source: Undo, as above · Vendor survey
- Why it matters: More code isn’t the same as faster delivery.
- Context: A perception measure, not cycle-time data.
15. Debugging after deployment 43%
- What it says: Respondents estimate 43% of AI-generated code changes need manual debugging in production, even after passing QA and staging.
- Source: Lightrun survey, reported by VentureBeat, 14 April 2026 · Vendor survey
- Why it matters: Verification, not generation, is now the constraint.
- Context: 200 SRE and DevOps leaders at firms with 1,500+ staff in the US, UK and EU. Lightrun sells observability tools.
Analysis. Telemetry says agents touch a large share of code; surveys say incidents are common and releases no faster. Both can be true if review, debugging and verification absorb the gain.
Agentic AI statistics on security and risk
16. Dormant agents with live credentials 76%
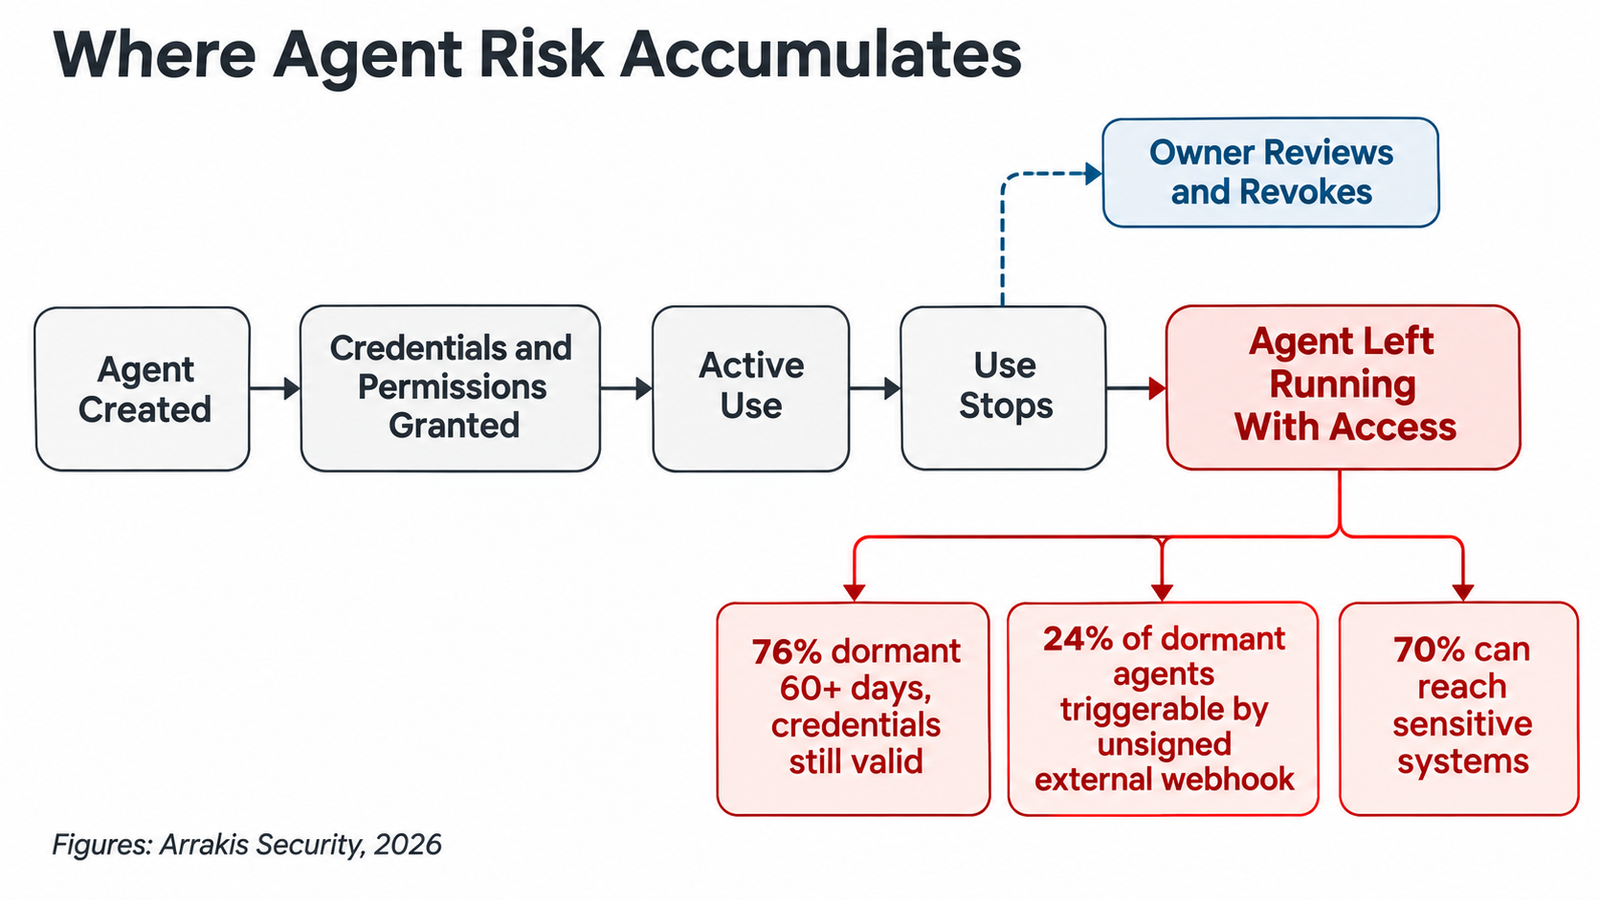
- What it says: 76% of agents examined by Arrakis hadn’t run in 60 days but kept working credentials and live triggers. 44% hadn’t run in 180 days.
- Source: Arrakis Security, 2026 Autonomous Agents Threat Report, via HackRead, 21 October 2026 · Vendor telemetry
- Why it matters: An unused agent with valid credentials is an unmonitored access path. Our explainer on why agents shouldn’t share a service account covers the identity side.
- Context: Thousands of agents in Arrakis customer environments over 12 weeks. Dormant doesn’t always mean abandoned.
17. Externally triggerable dormant agents 24%
- What it says: 24% of dormant agents could be started by an unsigned webhook from outside the organisation.
- Source: Arrakis, as above · Vendor telemetry
- Why it matters: An outsider could wake a forgotten agent with nobody watching.
- Context: This shows exposure, not observed attacks.
18. Agents that reach sensitive systems 70%
- What it says: 70% of agents could reach sensitive systems such as cloud storage, and 82% carried at least one exposure.
- Source: Arrakis Security · Vendor telemetry
- Why it matters: Agent permissions are broad by default.
- Context: Arrakis’s definitions of “sensitive” and “exposure” aren’t published in detail.
19. AI in disruptive ransomware attacks 84%
- What it says: 84% of respondents whose organisations suffered disruptive ransomware experienced attacks that exploited AI in some way.
- Source: Semperis 2026 Ransomware Risk Report, via Virtualization Review, 14 October 2026 · Vendor survey
- Why it matters: 44% reported attacks that manipulated the victim’s own AI agents or systems.
- Context: 1,200 IT and security professionals in nine countries, victims only; not a share of all ransomware worldwide.
20. Agents acting out of bounds 80%
- What it says: 80% of organisations said their AI agents had taken unintended actions, and 23% said agents were tricked into revealing access credentials.
- Source: SailPoint, via Business Wire, 28 May 2025 · Vendor survey
- Why it matters: It’s a pre-2026 baseline that the 2026 telemetry above appears to confirm.
- Context: 353 security professionals on five continents, surveyed by Dimensional Research in 2025.
Analysis. Arrakis measured what agents could do; Semperis asked victims what happened. Neither proves a given exposure was exploited, but together they show agents behaving like privileged identities that are created quickly and rarely retired.
Agentic AI statistics on governance
21. Unapproved AI at work 49%
- What it says: Among workers using AI at work, 49% reported using unapproved AI solutions. Senior leaders were 32% more likely than staff to do so.
- Source: Deloitte TrustID Workforce Index, May 2026 · Independent survey
- Why it matters: Shadow AI starts at the top.
- Context: The denominator is AI-using workers, not all employees. The sample size isn’t published on the page.
22. Mature agent governance 21%
- What it says: Only 21% of companies report a mature model for governing autonomous agents.
- Source: Deloitte, State of AI in the Enterprise 2026 · Independent survey
- Why it matters: Set against the 75% planning to deploy, it’s the governance gap in one figure.
- Context: Self-assessed maturity, from the 3,235-respondent survey above.
23. Trust as a barrier 70%
- What it says: 70% of respondents saw the inability to trust and govern agents as a barrier to adoption.
- Source: Deloitte survey of 500 senior managers, cited on the TrustID page above · Independent survey
- Why it matters: Governance gaps are slowing adoption.
- Context: Country isn’t stated.
24. Merged without human review 0.5% (median), 9% (leaders)
- What it says: The median Jellyfish customer auto-merges 0.5% of PRs with no human review. Lead adopters merge 9%.
- Source: Jellyfish, AI Engineering Trends · Vendor telemetry
- Why it matters: Human oversight is still the default, but leaders are relaxing it.
- Context: Jellyfish customers only.
25. Policies to secure agents 44%
- What it says: 44% of organisations had policies in place to secure AI agents, while 82% already used them.
- Source: SailPoint, as above, May 2025 · Vendor survey
- Why it matters: The gap between use and policy predates this year’s deployments.
- Context: 2025 data, with the same sample as statistic 20.
Analysis. Governance is the slowest-moving set of agentic AI statistics here. The 21% maturity figure, 49% shadow AI and dormant agents all say the same thing: agents are created faster than anyone takes ownership of them.
Agentic AI statistics on models and infrastructure
26. Open-weights gap 12 points
- What it says: In Artificial Analysis Intelligence Index v5, Claude Opus 5.5 scored 58 and Kimi K3.1 Pro, the top open-weights model, scored 46.
- Source: Artificial Analysis, Intelligence Index v5, 27 October 2026 · Benchmark
- Why it matters: The gap widened from 3 points in v4.3.
- Context: Kimi K3.1 Pro’s weights weren’t released at publication; among released-weights models the gap is 26 points. v5 changed the benchmark mix, so scores aren’t comparable with v4.
27. Private test data ~60%
- What it says: About 60% of Index v5 now uses private test sets or held-out answers.
- Source: Artificial Analysis, as above · Benchmark
- Why it matters: Private tests reduce the chance that models were trained on the answers, and may explain the score shifts.
- Context: It changes comparability with earlier index versions.
28. Open-source share of tokens vs spending 19% vs 4%
- What it says: Open-source models handled about 19% of tokens but 4% of model spending.
- Source: Menlo Ventures · Industry estimate
- Why it matters: Cheap models are taking volume, while frontier models keep the revenue.
- Context: Menlo says “open-source”; most of these models are open-weight.
29. Token prices $0.13 and $0.70 per million
- What it says: The average open-source token price fell 3.3x to $0.13 per million. Closed models fell 24% to a blended $0.70.
- Source: Menlo Ventures · Industry estimate
- Why it matters: Falling unit prices haven’t reduced total bills.
- Context: These are Menlo’s estimated averages, not list prices.
30. Agents’ token appetite 4x and 15x
- What it says: In Anthropic’s research system, agents used about 4 times the tokens of chat interactions, and multi-agent systems about 15 times.
- Source: Anthropic Engineering, 13 June 2025 · Company measurement
- Why it matters: It explains why agent adoption raises consumption so sharply.
- Context: One company’s system, measured in 2025.
Analysis. Agents explain why token volumes and bills rise together as prices fall, and frontier models’ renewed benchmark lead helps explain why buyers keep paying their premium.
What these agentic AI statistics reveal together
- Spending and usage are rising faster than measured value. Spend is up several-fold and agents touch much of the code, but surveys show no faster releases.
- Agents are an identity problem as much as a model problem. Dormant credentials, external triggers and broad permissions recur across sources.
- The evidence base is concentrated. A few vendors produce most of the telemetry, so many headline numbers describe their customers, not the market.
What businesses should measure next
The missing measurements matter most:
- Cost per completed task, not per token.
- Time from code generation to safe release.
- The share of agents with an owner and an expiry date.
- Incidents traced to agent actions as well as to AI-generated code.
How these agentic AI statistics were verified
Each figure was checked against the closest available source on 4 November 2026; where the original couldn’t be loaded, the entry names the outlet used. Other statistics sites weren’t used, and unconfirmed leads were dropped.
Frequently asked questions
What are the most important agentic AI statistics for 2026?
Menlo’s $176.8 billion deployment-spending estimate, Deloitte’s 21% governance-maturity figure and Arrakis’s 76% dormant-agent finding give the clearest picture of spending, oversight and risk.
How much are enterprises spending on AI in 2026?
Menlo Ventures estimates $176.8 billion in enterprise AI deployment spending as of September 2026, for US-surveyed enterprises, as an annualised run rate.
Are AI coding agents improving productivity?
The evidence is mixed. Agents touch a large share of merged code, but surveys report frequent incidents and no faster releases.
What are the biggest AI agent security risks?
Over-broad permissions, long-lived credentials on unused agents, external triggers and manipulation of agents themselves.
How many companies have mature AI agent governance?
About one in five, according to Deloitte’s 2026 survey of 3,235 business and IT leaders.
How often are these agentic AI statistics updated?
Monthly. Each figure keeps its original publication date, and the page date changes only when figures are added or revised.
Keep reading
Here are the latest posts from the blog.

Enterprise AI Spending Hit $177B. Agents Are Driving the Bill

Machine Unlearning: Can We Really Trust an Edited AI Model?

30 Agentic AI Statistics for 2026: Adoption, Spending and Risk