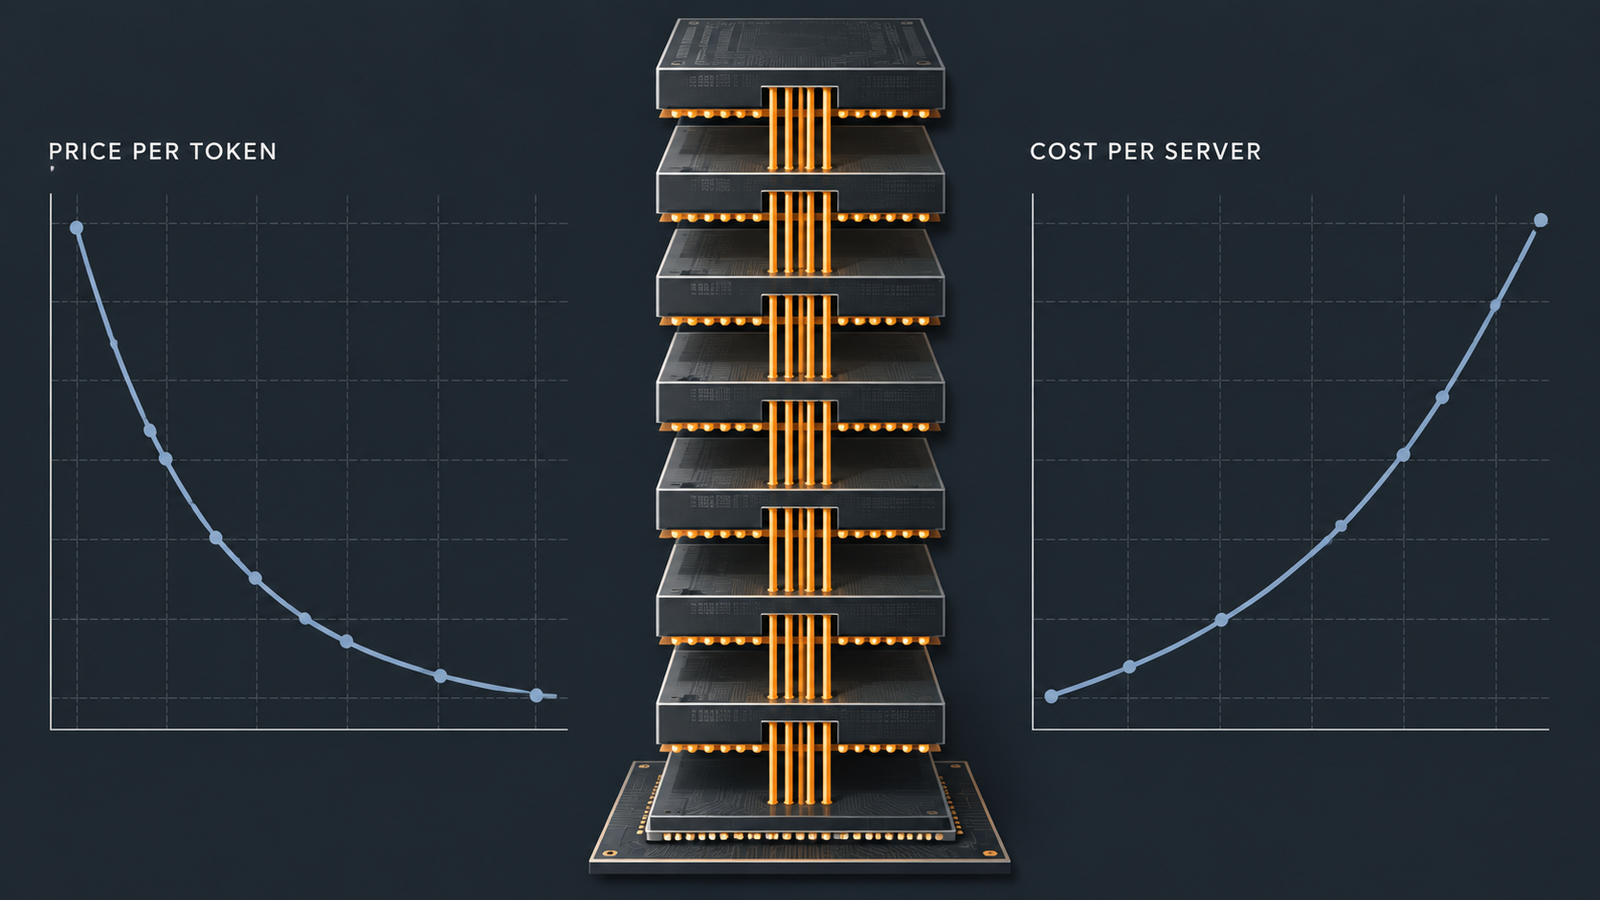
The invoice from your model provider and the quote from your server vendor are moving in opposite directions, and both are telling the truth.
Epoch AI’s benchmark-anchored work puts the decline in inference prices at a median of roughly 50x per year across six benchmarks, rising to around 200x per year when restricted to data after January 2024. Meanwhile, Meta raised its 2026 capital expenditure guidance on 29 April 2026 from $115–135 billion to $125–145 billion, and Mark Zuckerberg pointed to memory pricing as a driver, according to Fortune’s reporting from the call.
Both are true because they sit at different layers. Token pricing is a retail price for an output. Infrastructure cost is what somebody had to buy to produce it. Between those layers sits memory, which spent 2026 becoming the most volatile input in the AI supply chain.
Key takeaways
- The 90% quarter is history, and that matters. TrendForce forecast conventional DRAM contract prices rising 90–95% QoQ in 1Q26. By 3Q26 the same firm forecast 13–18%. The rate of increase collapsed; the price level did not come back down.
- Server DRAM is now a four-figure line item per module. Seoul Economic Daily reported on 17 September 2026 that the fixed contract price for a 64GB DDR5 server RDIMM stood at $1,500 as of 15 September, against $272 a year earlier.
- HBM consumes wafer area out of proportion to the bits it delivers. TrendForce estimates HBM will take roughly 30% of the top three suppliers’ DRAM wafer input by end-2027 while supplying only about 13% of DRAM bits.
- A faster accelerator is not automatically a cheaper inference system. Per-chip compute has been growing faster than per-chip bandwidth, which raises the batch size needed to keep silicon busy.
- Context length is a cost multiplier that never appears on a rate card. In the illustrative model below, moving from 8k to 32k tokens of context cuts concurrent requests per accelerator roughly four-fold.
- Memory inflation moves the rent-or-own crossover, but less than the headlines imply. In the illustrative server model, the utilisation needed to beat the cheapest public cloud rate shifts from roughly 45% to roughly 49%.
- Micron reports fiscal Q4 2026 results on 30 September 2026, the first full quarter of guidance after its 84.6% GAAP gross margin quarter. It is the clearest near-term read on whether supply is loosening.
Quick Navigation
- Start With the Memory Bill: What AI Memory Costs Look Like in 2026
- How HBM Rewrote the Allocation Problem Behind AI Memory Costs
- Memory Bandwidth Can Matter More Than FLOPS
- Repricing a Self-Hosted Inference Server: Where AI Memory Costs Land
- Rent or Own: How AI Memory Costs Change the Calculation
- Why Token Pricing Hides Your Real AI Memory Costs
- What to Watch Next in AI Memory Costs
- What AI Infrastructure Teams Should Re-Model
- Frequently Asked Questions
Start With the Memory Bill: What AI Memory Costs Look Like in 2026
The most quoted number from this cycle is already out of date, and reusing it without context is the fastest way to get the story wrong.
TrendForce’s memory pricing survey of 2 February 2026 revised its 1Q26 forecast for conventional DRAM contract prices upward from 55–60% QoQ to 90–95% QoQ, with server DRAM projected to climb around 90% QoQ, which the firm called the largest quarterly increase on record. That figure gets recycled constantly. It was a first-quarter forecast.
Read the rest of the series and a different shape emerges. TrendForce projected 58–63% QoQ for 2Q26 on 31 March, then 13–18% QoQ for 3Q26 on 3 July, with server DRAM in the same band. On 30 June it raised its 4Q26 PC DRAM forecast to only 3–8% QoQ.
So the rate of increase fell sharply across 2026. The level did not. Conflating the two produces bad procurement decisions in both directions.
Where has the level landed? Seoul Economic Daily reported on 17 September 2026 that as of 15 September, the fixed contract price for a 64GB DDR5 server DRAM module stood at $1,500, roughly 5.5 times the $272 recorded a year earlier, with some spot transactions near $3,100. That tracks a Citi research note dated 12 May 2026 projecting the same module rising from $873 in Q1 2026 to roughly $1,586 by Q4.
The categories are not interchangeable. The $1,500 figure is a fixed contract price for one module type; the $3,100 figure is a spot transaction, and spot diverges widely from contract in tight markets. Neither reflects what a hyperscaler with a long-term agreement pays. TrendForce noted on 9 July 2026 that several US cloud providers had signed multi-year LTAs restricting price increases for those customers, which is why moderation in headline prices does not reach all buyers evenly.
The supplier side confirms the magnitude. Micron’s fiscal Q3 2026, ended 28 May 2026, produced revenue of $41.46 billion against $9.30 billion a year earlier, with GAAP gross margin at 84.6% versus 37.7%. A memory manufacturer earning 85 cents of gross margin on the dollar is the same fact as your RDIMM quote, seen from the other end.
Conventional DRAM and HBM are different products with different pricing mechanics. HBM is negotiated annually rather than quarterly, which is why its contract prices lagged the commodity DRAM surge. That lag is now closing, and the reason has nothing to do with demand for HBM.
How HBM Rewrote the Allocation Problem Behind AI Memory Costs
HBM does not simply compete with conventional DRAM for customers. It competes for wafers, and it is an inefficient consumer of them.
TrendForce estimates that HBM wafer input across the top three suppliers will account for approximately 18%, 22% and 30% of total DRAM wafer input at the end of 2025, 2026 and 2027, while representing only about 8%, 9% and 13% of total DRAM bit supply over the same period. These are TrendForce estimates rather than disclosed manufacturer figures, and should be read as a modelled view of a market whose participants publish very little.
Hold those two series side by side. By end-2027, on this estimate, roughly 30% of wafer starts produce roughly 13% of the bits. HBM stacks DRAM dies vertically using through-silicon vias and a logic base die, and the die area, packaging yield and test burden mean each delivered gigabyte absorbs far more capacity than a DDR5 gigabyte.
That is the crowding-out mechanism in one sentence: every wafer allocated to HBM removes a disproportionate quantity of conventional DRAM from the market.
The twist in 2026 is that the crowding ran in an unexpected direction. TrendForce reported on 2 June 2026 that, on its analysis of per-wafer revenue derived from die size, yield and per-gigabit pricing, HBM wafer revenue was overtaken by DDR5 64GB RDIMM in 1Q26, with HBM profitability falling below the RDIMM’s from that quarter on. Commodity server memory briefly became the better use of a wafer than the exotic AI product.
Suppliers reallocate capacity in response, depending on where HBM contract negotiations land. TrendForce’s conclusion is that the three major manufacturers will raise HBM quotations substantially in 2027 to restore the premium. That is a forecast, not a settled outcome.
The supply side offers little relief on a 2027 budget timescale. SK hynix CEO Kwak Noh-Jung told Reuters on 10 July 2026 that 2027 would be the worst year in the industry’s history from a supply perspective, with wafer and manufacturing growth around 12% falling well short of demand, and demand exceeding capacity beyond 2030. TrendForce estimated on 9 July 2026 that total RDIMM bit supply will grow only 15–20% year over year in 2027, lagging server CPU shipment growth.
Epoch AI found that AI chips consumed over 90% of total HBM production in 2025. There is no meaningful non-AI buyer left to displace.
Memory Bandwidth Can Matter More Than FLOPS
Everything above concerns what memory costs to buy. This section concerns why you need so much of it.
Inference splits into two phases with opposite hardware profiles. Prefill reads the entire prompt in one parallel pass and saturates the arithmetic units. Decode generates one token at a time, and each token requires reading the model’s weights plus the accumulated key-value cache out of memory to perform a comparatively tiny amount of arithmetic. Decode is bound by memory bandwidth, not by compute. As Databricks put it in its inference performance work, achieved memory bandwidth predicts token generation speed better than peak compute throughput does.
Why batch size sets your AI memory costs
Consider a 70-billion-parameter dense model at FP8, so roughly 70 GB of weights. On an accelerator with 8 TB/s of theoretical HBM bandwidth achieving 70% in practice, the chip reads the full weight set about 80 times per second. Serve one user and you get roughly 80 tokens per second and a very expensive token. Serve 64 users in a batch and the same 80 weight reads produce around 5,120 tokens per second, because the weights were fetched once and used sixty-four times.
Batching is the economic engine of inference serving. Utilisation is not a nice-to-have; it is the denominator.
Context length as a memory cost multiplier
Capacity now reasserts itself. Every concurrent request carries its own KV cache, and that cache competes with the weights for the same HBM.
Illustrative example. Take a representative 70B-class model with grouped-query attention: 80 layers, 8 key-value heads, head dimension 128, cached at one byte per element. KV cache per token is 2 × 80 × 8 × 128 = 163,840 bytes, about 160 KB.
On a 192 GB accelerator holding 70 GB of weights, roughly 122 GB remains for cache. At 8,000 tokens of context each request needs about 1.31 GB, allowing roughly 93 concurrent requests. At 32,000 tokens each needs about 5.24 GB, allowing roughly 23.
Same hardware, same model, same advertised price per token. Four times fewer users per accelerator, and therefore roughly four times the infrastructure cost behind every token produced.
Now add the generational trend. NVIDIA’s Rubin VR200, due in the second half of 2026, carries 288 GB of HBM4 at 22 TB/s against Blackwell’s 8 TB/s on HBM3e, a 2.75x bandwidth gain. Dense FP8 throughput rises from roughly 4.5 to 17.5 PFLOPS over the same step, closer to 3.9x. Compute is outrunning bandwidth, so the batch needed to keep the newer chip busy grows, and that batch needs cache, and cache needs capacity. Capacity and bandwidth bind together, which is why the faster chip does not automatically yield the cheaper serving system.
Repricing a Self-Hosted Inference Server: Where AI Memory Costs Land
Illustrative example. These are modelled assumptions, not a vendor quotation. No accelerator vendor publishes street pricing, and system prices vary by volume, region and configuration. The point is to show which line moved.
Take an eight-accelerator inference node. Hold every assumption constant except system DRAM, priced at the two dated contract figures above.
| Component | Assumption | Cost |
|---|---|---|
| 8 accelerators | $30,000 each (illustrative) | $240,000 |
| CPU (2 sockets) | illustrative | $20,000 |
| Storage (4 × NVMe) | illustrative | $12,000 |
| Networking | illustrative | $24,000 |
| Chassis, PSU, cooling, assembly | illustrative | $25,000 |
| Subtotal excluding system DRAM | $321,000 | |
| 2 TB system DRAM (32 × 64GB RDIMM) at $272 | Sept 2025 contract | $8,704 |
| 2 TB system DRAM (32 × 64GB RDIMM) at $1,500 | 15 Sept 2026 contract | $48,000 |
System total at September 2025 memory pricing: $329,704. System total at September 2026 memory pricing: $369,000.
One line item moved. The system got about 12% more expensive, and system DRAM rose from 2.6% of the build to 13.0%.
Convert that to an operating rate. Amortise $369,000 straight-line over four years for $92,250 a year. Assume 10.2 kW of draw at a PUE of 1.3, giving 13.3 kW, which at $0.10 per kWh is roughly $11,600 a year. Add an illustrative $15,000 for colocation, support and operations. The annual total is about $118,900, or $14,858 per accelerator-year: $1.70 per accelerator-hour at 100% utilisation.
The same arithmetic on 2025 memory pricing gives $1.56.
Which assumptions move the number most
The DRAM line is real but not dominant. Three assumptions matter more.
Utilisation leads by a wide margin. At 50%, that $1.70 becomes $3.40 per delivered hour. At 30%, it becomes $5.66. Nothing else in the model has that leverage.
Amortisation period comes second. Moving from four years to three raises the hourly figure by roughly a third, and the useful-life assumption for AI accelerators is genuinely contested.
Accelerator price is third, and the assumption most likely to be wrong in your case. It carries its own memory exposure, since HBM is a large share of accelerator bill of materials, and HBM contract prices are exactly what TrendForce expects to rise in 2027.
Memory inflation raised this system’s cost by about 12% and its hourly rate by about 9%. Material, but not the multiple that consumer DRAM coverage implies, because a server is more than its memory.
Rent or Own: How AI Memory Costs Change the Calculation
Public list rates give a reference point. Inworld reported that NVIDIA B200 list rates spanned $3.49 to $14.24 per GPU-hour across clouds in April 2026, more than a four-fold spread for the same silicon.
Against the cheapest end of that range, the illustrative self-hosted node at $1.70 per accelerator-hour breaks even at about 49% utilisation. Under 2025 memory pricing the crossover sat near 45%. Memory inflation moved the threshold by roughly four percentage points.
That should temper the “memory prices killed self-hosting” framing. What determines the answer is whether you can keep accelerators busy.
Four forces push in different directions, and they do not cancel.
Owning gets harder as procurement risk rises. Lead times have stretched, 2027 memory allocation was reportedly settled during mid-2026 negotiations, and an organisation buying twenty nodes has no leverage.
Owning gets easier when the workload is predictable and high-volume. Steady batch inference, a fixed model, a known context distribution and no spiky traffic can hold 70% utilisation or better. At 70%, the self-hosted rate lands near $2.43 against a cloud floor of $3.49.
Renting gets harder as providers pass through their own memory bill. Cloud rates are downstream of DRAM and HBM contract pricing, with a lag set by each provider’s procurement contracts and depreciation schedules.
Renting gets easier when demand is uncertain, when you need to switch accelerator generations quickly, or when reserved-capacity discounts approach your amortised cost without the capital commitment. Reserved pricing is where memory inflation shows up most directly, because providers reprice reservations as their own inputs reset.
There is no universal answer, only a utilisation threshold that memory inflation nudged up slightly.
Why Token Pricing Hides Your Real AI Memory Costs
“$X per million tokens” is a real price. It is also an average over a distribution of workloads whose infrastructure costs differ by an order of magnitude. Four things break the correspondence between the rate card and the hardware.
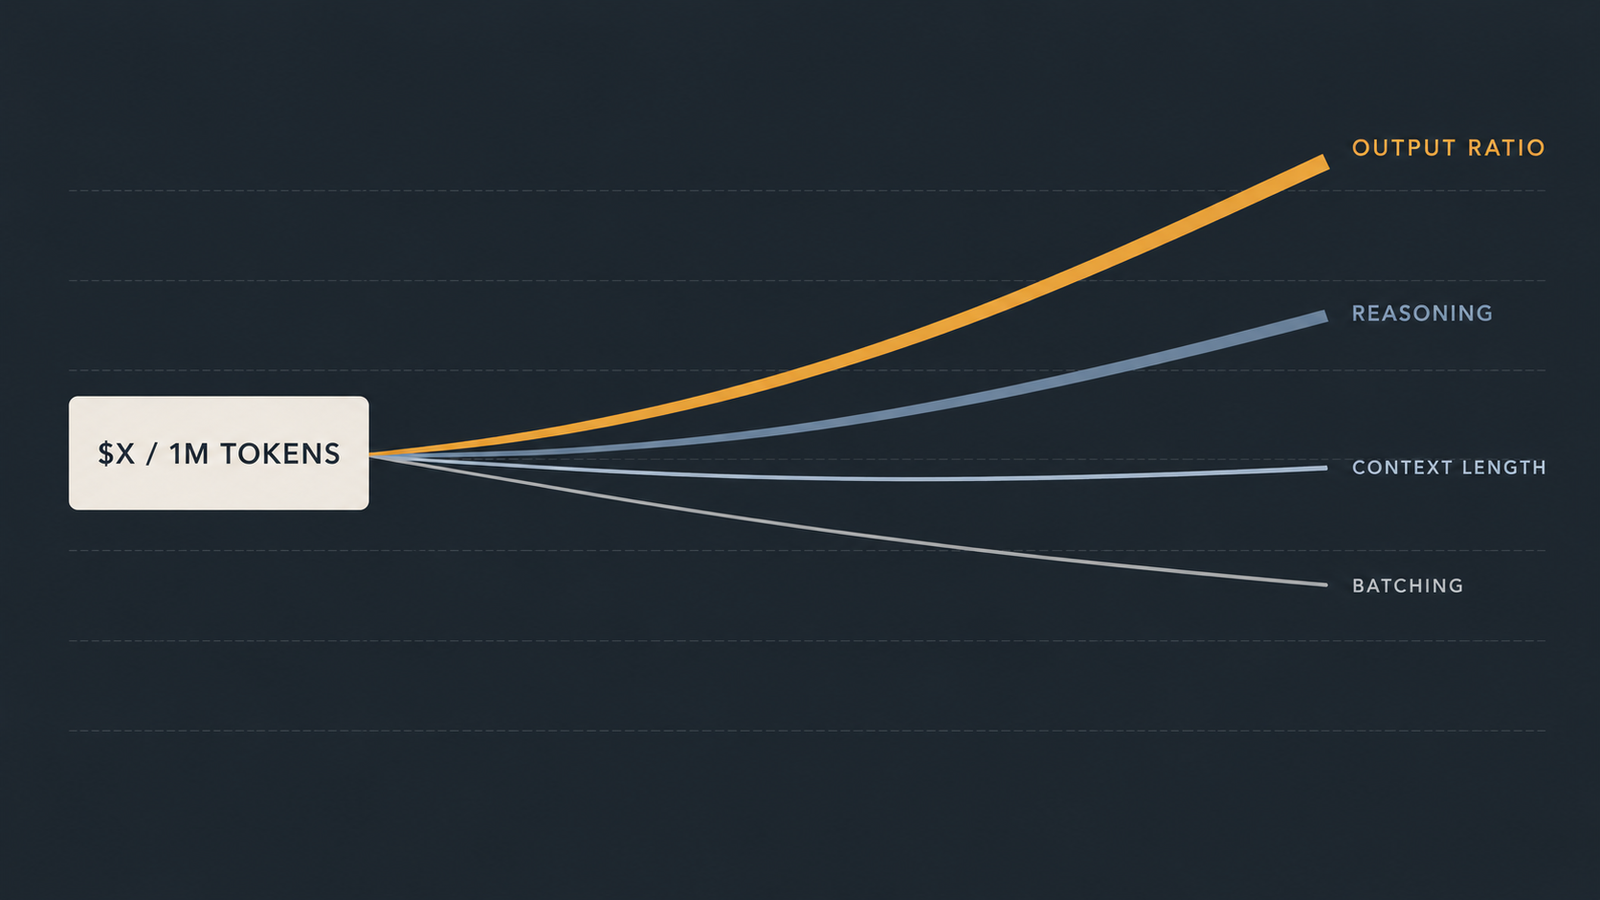
- Output intensity. Output tokens come from the bandwidth-bound decode phase and batch less efficiently than input tokens. Providers price output several times higher for that reason, but the ratio in your traffic decides where you sit inside the average.
- Reasoning workloads. Models that generate long internal chains produce many output tokens per user-visible answer. A task that took 500 output tokens under a non-reasoning model can take thousands, at the higher rate, through the more expensive phase.
- Context length. As the worked example showed, longer contexts shrink the concurrency an accelerator sustains. Providers absorb this through pricing tiers and caching discounts, but the physical cost lands on memory capacity.
- Batching and serving architecture. Continuous batching, prefill-decode disaggregation and paged attention all exist to raise the number of users served per weight read. Two providers on identical hardware running identical models can have materially different cost structures from serving-stack quality alone.
Agentic systems compound all four at once: more calls, longer accumulated context, more output tokens, and idle time between tool invocations that nobody is billed for and everybody is renting.
The rate card tells you what a token costs. It tells you almost nothing about how much HBM sat idle to guarantee the latency you were promised.
What to Watch Next in AI Memory Costs
- Micron’s fiscal Q4 2026 results on 30 September 2026. Still upcoming as of publication. Micron guided to roughly $50 billion in revenue at around 86% gross margin, after $41.46 billion at 84.6% in fiscal Q3. Watch the guidance commentary more than the print: it is the clearest public read on whether 2027 supply is loosening.
- HBM contract negotiations for 2027. TrendForce expects substantial increases. Whether suppliers get them decides how wafer capacity splits between HBM and DDR5, and therefore what happens to conventional server DRAM.
- Contract price direction, not magnitude. The series moved from 90–95% to 13–18% in three quarters. The 2027 question is whether increases keep moderating, as TrendForce currently expects for server DRAM through 2H27, or flatten.
- RDIMM bit supply against server CPU shipments. TrendForce’s 15–20% bit growth estimate for 2027, against faster CPU shipment growth, is the arithmetic behind the shortage.
- Configuration downgrades. TrendForce noted that since 1H26, some CSPs and OEMs shifted RDIMM configurations from 96GB and 128GB modules down to 32GB and 64GB. When buyers cut memory per server to manage cost, demand destruction is already underway.
- New fab and packaging capacity. SK hynix has committed to substantial expansion, but buildings and advanced packaging lines arrive on multi-year schedules.
What AI Infrastructure Teams Should Re-Model
Twelve numbers. If you cannot produce them from current data, that is the finding.
- Memory cost per server, split into HBM (inside the accelerator price) and system DRAM, as a share of total build
- Memory cost per accelerator, so accelerator generations are comparable on a like-for-like basis
- Achieved memory bandwidth utilisation during decode, not theoretical peak
- KV cache footprint per request at your actual p50 and p95 context lengths
- Average tokens per request, input and output counted separately
- Output-token ratio, which predicts the phase dominating your bill
- Accelerator utilisation, measured over a full week including troughs
- Cost per request, not cost per token
- Cost per million tokens from your own hardware, against the rate card you pay
- Server amortisation schedule, with the useful-life assumption written down
- Power and cooling at your actual PUE and electricity rate
- Cloud versus self-hosted exposure, as the utilisation threshold at which the answer flips
That last number is the one worth putting on a wall. Everything else here is an input to it.
Frequently Asked Questions
Why are AI memory costs rising?
AI accelerators need high-bandwidth memory, and HBM consumes far more wafer capacity per delivered gigabyte than conventional DRAM. TrendForce estimates HBM will take roughly 30% of the top three suppliers’ DRAM wafer input by end-2027 while supplying only about 13% of bits. That reallocation removes conventional DRAM from the market at the same time AI server demand is growing, so both HBM and ordinary server memory tighten together. SK hynix’s CEO told Reuters in July 2026 that 2027 would be the industry’s worst supply year on record.
Why does HBM matter for AI inference?
Generating each output token requires reading the model’s weights and accumulated attention cache out of memory. That makes token generation speed a function of memory bandwidth rather than arithmetic throughput. HBM delivers bandwidth by stacking DRAM dies directly beside the processor with very wide interfaces. NVIDIA’s Rubin VR200 carries 288 GB of HBM4 at 22 TB/s, against 8 TB/s on the prior Blackwell generation. Without that bandwidth, the compute sits idle waiting for data.
Is HBM more expensive than normal DRAM?
Per gigabyte, yes, and historically by a wide margin. The gap narrowed unusually in 2026. TrendForce reported that on its per-wafer revenue analysis, HBM was overtaken by DDR5 64GB RDIMM in the first quarter of 2026, which briefly made commodity server memory the more profitable use of a wafer. TrendForce expects suppliers to raise HBM contract prices substantially in 2027 to restore the premium. HBM contracts are negotiated annually, so they respond more slowly than quarterly DRAM pricing.
Does memory bandwidth affect inference cost?
Directly. Decode is bandwidth-bound, so bandwidth sets how many tokens a chip can produce per second, which sets the denominator in cost per token. Databricks has noted that achieved memory bandwidth predicts token generation speed better than peak compute. Batching raises effective throughput by serving many users from a single weight read, but each concurrent request needs its own KV cache in memory, so capacity constrains how far batching can go.
Why can AI inference get cheaper while servers get more expensive?
They are different accounting layers. Token prices reflect competition, algorithmic efficiency gains, quantisation and serving-stack improvements, and Epoch AI measures the decline at a median of roughly 50x per year across benchmarks. Server cost reflects component procurement in a supply-constrained market. A provider can pass through efficiency gains faster than its input costs rise, and absorb the difference in margin or in capital raised against future volume.
Keep reading
Here are the latest posts from the blog.

Claude API Rate Limits in 2026: How Many Requests Can You Run?

Enterprise AI Spending Hit $177B. Agents Are Driving the Bill

Machine Unlearning: Can We Really Trust an Edited AI Model?