The Ultimate Truth About 5 Ways Trainium and TPU Threaten Nvidia

Trainium TPU Nvidia margins

Custom silicon’s rise changes the Trainium TPU Nvidia margins conversation in a way market-share numbers never could. Most coverage frames AWS Trainium and Google TPU as a share story — who’s winning what percentage of the AI chip market. That misses the more important question entirely.

As a sensitivity example, a supplier could keep the same market share while earnings changed because gross margin fell. A move from the mid-70s to the mid-50s is an illustrative scenario here, not a forecast or evidence that competitors have already forced Nvidia to cut prices. Related reading: TPU Nvidia margins story.

This article separates disclosed product information from a hypothesis about competitive margins. A manufacturing-cost estimate, cloud price and end-to-end cost per token are different measures and should not be presented as one verified gap.

Key Takeaways on Trainium TPU Nvidia Margins
  • Nvidia reported GAAP gross margins of 75.0% for fiscal 2025 and 71.1% for fiscal 2026. Read the annual report for the effects of product mix, export-related charges and other factors; the change alone does not prove competitive pressure.
  • Trainium3 and Ironwood are product examples in this comparison. Generation names and announcement dates do not establish availability for a particular customer or region.
  • Inference demand is important to the competitive thesis, but the earlier 75% market forecast is not established by a cited primary forecast here.
  • CUDA’s moat is real for research and training, but weaker for repetitive, high-volume inference, which is where Trainium TPU Nvidia margins pressure concentrates.
  • The margin compression thesis here is a model, not a settled fact — treat specific percentages as informed estimates, not certainties.

Why Trainium TPU Nvidia Margins Are the Real Story, Not Market Share

For years, Nvidia enjoyed near-monopoly pricing power in AI accelerators, with gross margins in the low-to-mid 70s. AWS Trainium and Google TPU chips aren’t just alternative options anymore — for specific, high-volume workloads, they’re increasingly the economically rational choice, and that’s what makes the Trainium TPU Nvidia margins question different from a simple share fight.

The Trainium TPU Nvidia margins pressure mechanism works in three stages. First, a credible alternative emerges — hyperscalers prove custom silicon works at real production scale. Second, workload migration begins, with price-sensitive inference workloads shifting first. Third, negotiating leverage shifts, and even customers staying on Nvidia GPUs gain room to demand lower prices.

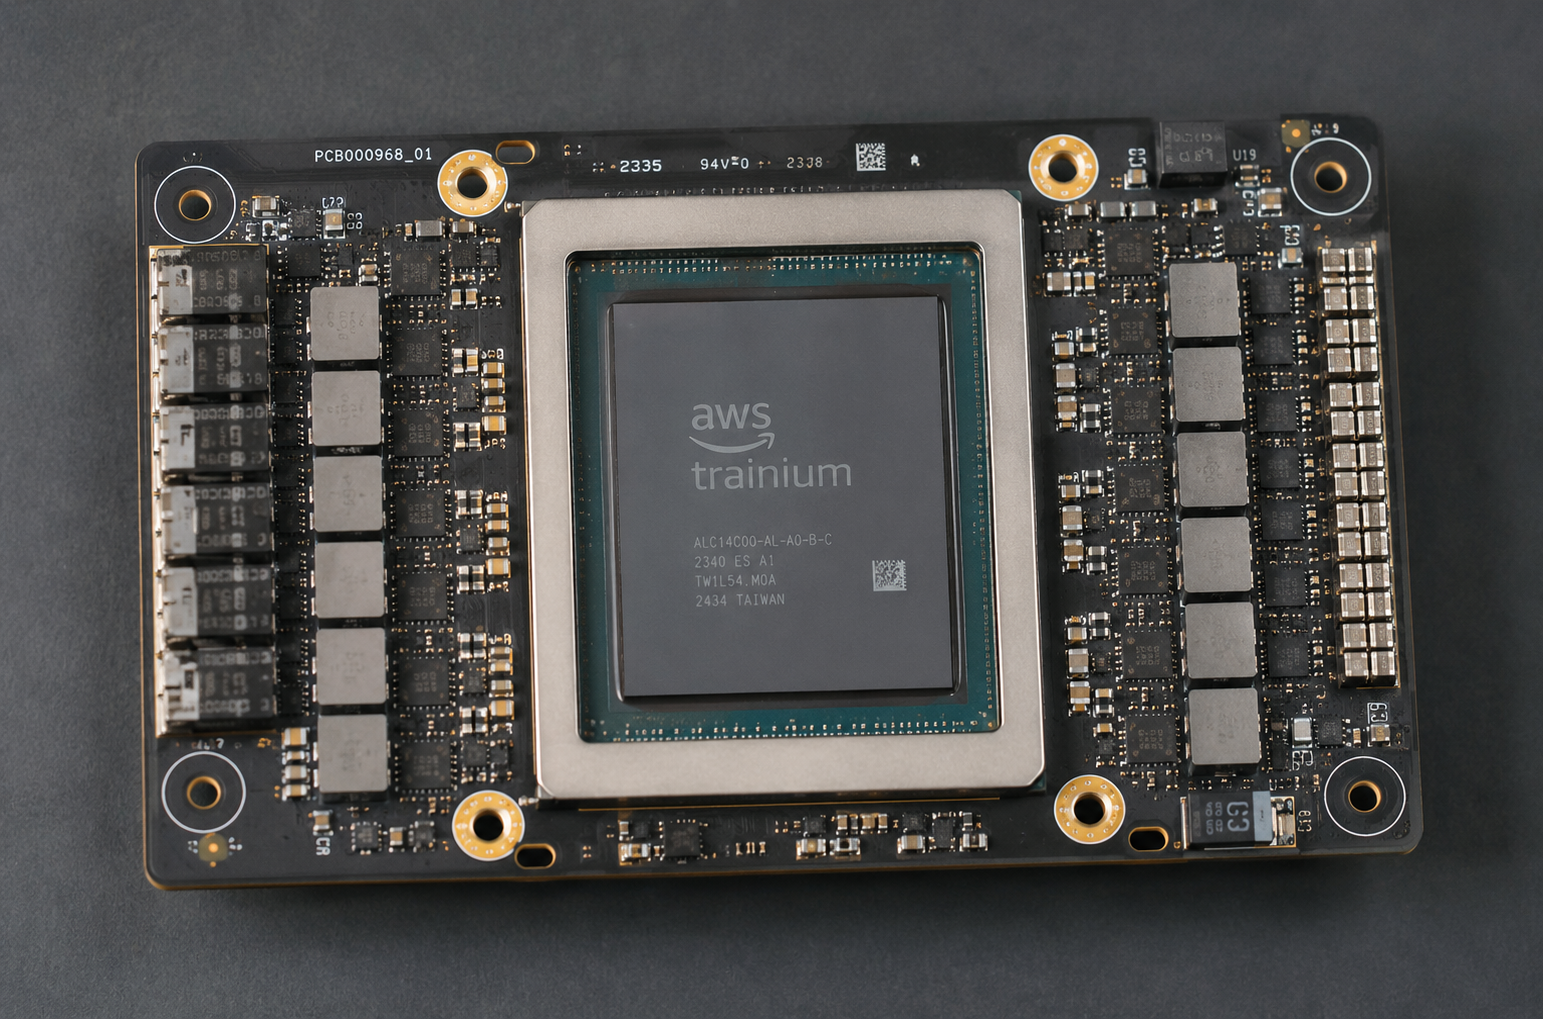
AWS announced Trn3 UltraServer general availability on December 2, 2025; each Trainium3 chip has 144 GB HBM3e. AWS’s up-to-4.4× figure compares UltraServers, not individual-chip compute. Google announced Ironwood general availability in November 2025, after its April unveiling. AWS announcement; Google announcement.

Designing a chip can change a provider’s economics, but it still entails design, fabrication, packaging, software and infrastructure costs. The earlier “few thousand dollars” manufacturing estimate is not established by the cited vendor disclosures.

Quantifying the Per-Token Cost Gap Behind Trainium TPU Nvidia Margins

A fair comparison needs the same model, precision, quality target, context lengths, latency target, batching, utilization and pricing basis. Peak compute or a component price alone does not establish cost per completed task.

H100 sale prices, Trainium manufacturing costs and TPU cloud charges are different measures. This article does not establish a comparable set of chip acquisition or manufacturing costs, so it should not describe a verified fraction-of-cost advantage.

If an evaluation found a 30% lower cost per successful task at the required quality and latency, multiplying that measured difference by actual workload volume would give a useful scenario. The 30% value here is an assumption, not a benchmark result.

Where the Savings in Trainium TPU Nvidia Margins Actually Compound

Custom designs may reduce some costs or improve workload fit, but a cloud provider still incurs fabrication, memory, networking, power, software and operating costs. Removing a supplier’s markup does not remove those expenses.

Power efficiency deserves more attention than it usually gets in the Trainium TPU Nvidia margins conversation. A large inference cluster drawing meaningfully less power doesn’t just save on electricity — it reduces cooling infrastructure requirements and lowers the power-delivery overhead baked into data center construction costs. At hyperscaler scale, those second-order savings are substantial and recurring, not one-time.

Which Workloads Move the Trainium TPU Nvidia Margins Needle First

Not all AI workloads carry equal weight in the Trainium TPU Nvidia margins story. Understanding which workloads migrate first reveals the realistic timeline for margin pressure.

Cloud providers use custom accelerators in production, but this article does not establish what share of each named consumer service runs on each chip or that all those workloads tolerate the same latency. Use workload-specific deployment evidence.

Commodity inference APIs are next in the Trainium TPU Nvidia margins progression. Standardized endpoints for popular open-source models are strong candidates, since customers care about cost per token, not which chip runs underneath. AWS can offer cheaper Bedrock inference on Trainium without most customers ever noticing or caring — they see only the invoice line item.

Where Trainium TPU Nvidia Margins Pressure Builds More Slowly

Fine-tuning and adaptation workloads are reasonably strong candidates too, since frameworks like JAX and AWS Neuron already support these workflows well. Large-scale pretraining is the hardest to shift — frontier model training demands massive parallelism and battle-tested distributed training tooling, where CUDA’s advantage is strongest. Even so, Google has trained Gemini models entirely on TPUs, which proves it’s possible even where it isn’t easy.

Some workloads stay on Nvidia longest regardless of cost: research and experimentation, where CUDA’s ecosystem lock-in is real; multi-cloud deployments, since Trainium and TPU exist only inside their respective clouds; and workloads needing frequent architecture changes.

An enterprise running workloads across AWS, Azure, and GCP for redundancy can’t practically standardize on a chip that only exists in one cloud. That keeps a meaningful slice of spending on GPUs regardless of per-token cost, and it’s a real limit on how far the Trainium TPU Nvidia margins shift can go.

The exact future share of inference demand is uncertain. An uncited percentage should not be treated as the basis for a margin forecast; show the forecast’s source, scope and assumptions before using it.

Modeling the Trainium TPU Nvidia Margins Timeline

Here’s where it’s worth being explicit about the Trainium TPU Nvidia margins model: the rest of this section is a forecast, not settled fact. Nvidia’s own numbers already moved once, from 75.0% in fiscal 2025 to 60.5% in Q1 fiscal 2026. That dip was driven by a $4.5 billion charge tied to U.S. export licensing on H20 chips sold into China, not by Trainium or TPU competition. Margins recovered to the 71–75% range in the following quarters.

That history matters because it shows Nvidia’s margins can move sharply for reasons that have nothing to do with custom silicon. Any model of competitive margin compression needs to account for that noise rather than reading every dip as proof of the thesis.

With that caveat in place, a reasonable model looks like this. In the near term, demand for Nvidia’s training chips still outpaces supply, so reported margins stay resilient even as custom silicon absorbs incremental inference demand that might otherwise have gone to Nvidia — you see slower growth in what could have been, not lost sales you can point to directly.

As Trainium3 and TPU v7 mature further and hyperscalers gain credible alternatives across most inference workloads, Trainium TPU Nvidia margins pressure should show up as shifting negotiating leverage — even for customers who still need Nvidia for training.

A useful historical parallel: when enterprise storage vendors faced credible cloud alternatives in the mid-2010s, list prices didn’t collapse overnight. Discount rates quietly expanded over several quarters before margin erosion became visible in reported numbers. Nvidia’s situation could plausibly rhyme with that pattern, though the magnitude and timing remain genuinely uncertain.

What Could Speed Up or Slow Down Trainium TPU Nvidia Margins Pressure

Several variables could accelerate the timeline: faster-than-expected maturity in Trainium’s software ecosystem, continued open-source model growth reducing training-chip demand growth, or a major cloud provider undercutting inference pricing aggressively. Several variables could delay it too: CUDA’s moat proving deeper than expected, new Nvidia architectures delivering step-change efficiency gains, or custom silicon programs hitting yield problems at scale.

The direction and size of any competitive margin effect remain uncertain. Product competition is evidence of alternatives, not proof of a particular future gross margin.

The CUDA Moat: Why Trainium TPU Nvidia Margins Pressure Builds Slowly

Any honest look at Trainium TPU Nvidia margins has to address CUDA directly — it’s Nvidia’s most powerful advantage, and also the most frequently overstated one in either direction.

CUDA represents decades of software investment. Millions of developers know it, and thousands of libraries depend on it. For researchers prototyping new architectures, CUDA remains genuinely unmatched, and switching costs are real. But the moat matters much less for production inference than for research, and that distinction is central to the whole Trainium TPU Nvidia margins story.

Inference workloads are repetitive, which matters a lot for the Trainium TPU Nvidia margins case — once a model is optimized for a chip, it runs the same operations billions of times, so the upfront porting cost amortizes quickly at scale. Frameworks like PyTorch, JAX, and TensorFlow increasingly support multiple hardware backends, letting developers write model code once and compile for different targets.

How the Porting Cost Compares in the Trainium TPU Nvidia Margins Trade-Off

Porting time depends on supported operators, model architecture, custom kernels, serving infrastructure and performance targets. Measure the work and savings for the actual pipeline rather than assuming that a small team can always migrate it in a few weeks.

There’s historical precedent for ecosystems eroding under strong enough economic incentive. Intel’s x86 ecosystem was once considered unbreakable; ARM chips now dominate mobile and are gaining fast in servers and laptops. CUDA likely delays custom silicon adoption in the Trainium TPU Nvidia margins story. It probably doesn’t prevent it, since the per-token cost advantages are large enough that hyperscalers have strong reasons not to ignore them indefinitely.

What Trainium TPU Nvidia Margins Mean for the Broader Chip Market

The Trainium TPU Nvidia margins dynamic reshapes the competitive picture well beyond Nvidia’s own numbers.

For hyperscalers, the build-versus-buy calculation has shifted meaningfully. Every major cloud provider now has or is developing custom AI silicon — Microsoft works with AMD and is developing its own Maia chips, and Meta designs its own MTIA inference accelerators. The trend shows no sign of reversing.

For AMD and Intel, the picture is mixed. AMD benefits in the near term as a credible Nvidia alternative but faces similar long-term pressure from custom silicon; its MI300X has won real deployments, though those wins may prove transitional as hyperscaler chips mature further. Intel’s Gaudi accelerators compete in an increasingly narrow middle market.

For startups like Groq, Cerebras, and SambaNova, the environment is getting harder. They lack both Nvidia’s software ecosystem and the captive demand hyperscaler chips enjoy, which narrows their window for establishing a durable position.

More competition can benefit application developers, but a lower component or instance price does not guarantee a lower cost per successful task. The five-cent-to-two-cent example is a hypothetical illustration, not an observed result.

For investors, Nvidia remains a formidable company, but the Trainium TPU Nvidia margins question is central to whether current valuations assume margins stay near historical highs indefinitely or account for real compression risk over the next several years.

Conclusion

The Trainium TPU Nvidia margins story is the most significant structural question facing Nvidia’s financial model since its rise to AI dominance. To be clear, this isn’t a bearish take on AI broadly — it’s a realistic look at where chip economics are heading.

What is documented here is the availability and vendor-described specifications of selected accelerators and Nvidia’s reported financial results. A universal per-token advantage and a particular competitive margin trajectory are not established; they require matched workload measurements and an explicit financial model.

Investors can test several margin scenarios rather than treating one as inevitable. Architects should benchmark available hardware on their own workload and include migration, operations, utilization and quality costs before deciding whether to switch.

Custom silicon is a competitive factor to evaluate. Its effect on Nvidia’s future prices and margins remains a hypothesis whose outcome depends on products, supply, software and customer demand.

FAQ About Trainium TPU Nvidia Margins

How Much Cheaper Is Inference in the Trainium TPU Nvidia Margins Comparison?

There is no universal per-token saving established here. Compare the same task, model quality and latency target using a stated pricing date and utilization level, and include the cost of migration and operations.

Will Custom Silicon Completely Replace Nvidia in the Trainium TPU Nvidia Margins Story?

Unlikely in the near term. Trainium and TPU chips target specific workload segments, primarily high-volume inference, while Nvidia is likely to retain strong positions in frontier model training, research, multi-cloud deployments, and enterprise workloads. Since inference represents a large and growing share of total AI compute demand, though, even a partial shift moves real dollars in the Trainium TPU Nvidia margins equation.

What Is CUDA and Why Does It Matter for Trainium TPU Nvidia Margins?

CUDA is Nvidia’s proprietary programming platform for GPU computing, built over roughly two decades, with tools and libraries millions of developers rely on. It creates real switching costs, since code written for Nvidia GPUs doesn’t automatically run elsewhere. That advantage matters far more for research and novel architecture development than for repetitive, high-volume inference — which is exactly where Trainium TPU Nvidia margins pressure concentrates.

When Will Trainium TPU Nvidia Margins Pressure Actually Show Up in Nvidia’s Numbers?

There’s no confirmed date, and it’s worth separating fact from forecast here. Nvidia’s margins have already moved once, but that specific dip was tied to export-control charges, not competition. A reasonable model suggests visible Trainium TPU Nvidia margins pressure could build as Trainium3 and TPU v7 mature further and hyperscalers gain more negotiating leverage — but the timing and magnitude remain genuinely uncertain.

Which Companies Are Building the Custom Silicon Behind Trainium TPU Nvidia Margins Pressure?

Google, AWS, Microsoft and Meta have custom-silicon programs, but the exact generation and regional availability should be checked in current vendor documentation. Product availability is distinct from a manufacturing-cost or total-cost claim.

Should a Startup Build on Custom Silicon Given the Trainium TPU Nvidia Margins Trend?
For most startups, sticking with Nvidia GPUs still makes sense in the near term, given the CUDA ecosystem’s maturity and the flexibility Nvidia offers across cloud providers. Startups planning for significant inference volume down the line, though, benefit from designing model code with multi-hardware portability in mind from the start, since that keeps the Trainium TPU Nvidia margins cost advantage available later without a costly rewrite.

The Truth About Google’s TPU Deal With Anthropic

Google TPU

Google’s TPU partnership with Anthropic raises a capacity-planning question: how should a cloud provider balance customer commitments with its own research needs? The partnership is public; a claim that Anthropic has caused Google researchers to queue for chips needs separate operational evidence.

This isn’t just a funny headline worth a chuckle and a scroll-past. Underneath the Google TPUs Anthropic story lies a genuinely interesting story about token economics, inference costs, and why custom silicon matters more than ever. Once you understand the business logic, Google’s decision makes a lot more sense than it first appears.

The Google TPUs Anthropic relationship connects directly to bigger questions about AI pricing, cache optimization, and what it actually costs to serve billions of tokens every single day.

Key Takeaways on Google TPU Anthropic

  • Anthropic’s Google Cloud partnership includes TPU capacity; the public announcements do not establish the claimed investment condition.
  • Anthropic uses Google TPUs alongside Amazon Trainium and NVIDIA GPUs, rather than choosing one platform exclusively.
  • AI model pricing and workload cost depends on the selected model and request mix; cache savings are not a universal 167X ratio.
  • Public announcements do not establish Google research delays caused by Anthropic’s allocation.
  • Future capacity and software efficiency may change allocation options; announced capacity is not the same as delivered availability.

Why Google TPU Anthropic Uses Makes Economic Sense

Anthropic announced its Google Cloud partnership in February 2023, saying it would use GPU and TPU clusters to train, scale and deploy its AI systems. Google’s November 2023 expansion announcement specifically added TPU v5e for inference. The public announcements establish a compute partnership; they do not establish that TPU use was a condition of Google’s investment.

Selling TPU capacity generates cloud revenue. Google Cloud reported $8.41 billion in Q3 2023 revenue; that historical figure does not isolate revenue attributable to Anthropic. Separately, Anthropic describes a multi-platform compute strategy using Google TPUs, Amazon Trainium and NVIDIA GPUs. TPU use should not be described as an exclusive replacement for those other platforms.

Using a cloud platform can create migration costs through software, data placement and operational processes. Their size depends on the workload. Anthropic’s disclosed use of multiple providers means this partnership should not be treated as proof that it cannot move or distribute workloads.

The Business Logic Behind Google TPUs Anthropic Runs On

A provider serving both external customers and internal research teams must plan for their combined demand. Whether these jobs contend for the same pool depends on capacity, reservations and scheduling policy; the announcements do not disclose that allocation.

Consider a hypothetical researcher requesting a large training reservation. If an overlapping reservation exhausts the same pool, the job may have to wait or move. This is a capacity-planning example, not evidence of a particular Google or Anthropic scheduling incident.

A capacity conflict is a plausible scenario when several large training jobs need the same resources. The public partnership announcements do not establish actual wait times for Google’s internal teams or attribute specific delays to Anthropic.

How Google TPUs Fit Anthropic’s Compute Mix

Latency, cost per token and total cost of ownership are useful criteria for evaluating TPUs. They explain what a hardware assessment should measure, but the public announcements do not disclose Anthropic’s internal comparison or a single decisive factor.

Inference latency measures how quickly a system produces tokens. Accelerator comparisons should specify the model, batch size, precision and latency target; a chip’s theoretical throughput alone does not establish serving performance.

Compare cost per completed request at the required latency and quality, rather than assuming a fixed TPU-over-GPU ranking. Hardware variant, cluster size, software and contract pricing can change the result. The table below is a comparison checklist, not a benchmark of Anthropic’s deployment.

Why Availability Matters Alongside Performance

Availability, usable performance, software and workload shape all matter when comparing accelerator capacity. The public partnership announcements do not establish a single decisive reason for Anthropic’s allocation across chips. Its continued use of multiple platforms is the verified fact; the tradeoff analysis here should not be presented as an exclusive TPU-over-GPU decision.

Power consumption contributes to serving cost. Assess it against useful tokens or completed requests under the same workload and latency constraints; no comparable power-per-token measurements for this deployment are supplied here.

Volume commitments may affect commercial pricing, but the announcements do not disclose the effective price Anthropic pays per TPU-hour. A claim that its TPU pricing necessarily undercuts an equivalent GPU service would require that evidence.

Total cost also includes networking, storage, software and migration effort. Google Cloud integration may matter for a particular deployment, but it does not by itself establish Anthropic’s total-cost advantage over other platforms.

Metric TPU v5e (Google Cloud) NVIDIA A100 (Comparable) NVIDIA H100 (Premium)
Inference throughput Workload-dependent Workload-dependent Workload-dependent
Cost per chip-hour Workload-dependent Workload-dependent Workload-dependent
Power efficiency Workload-dependent Workload-dependent Workload-dependent
Memory bandwidth 819 GB/s 2 TB/s 3.35 TB/s
Availability for large clusters Depends on quota, reservation and contract Depends on provider and reservation Depends on provider and reservation

Google TPU Anthropic and the Real Economics of Serving Claude

LLM serving combines input processing, output generation, memory and other operating costs. API prices describe what customers pay; they do not disclose a provider’s underlying margin or the hardware cost of each request.

Input, output, cache writes and cache reads are separate billing categories. Compare the same model and workload, including new output tokens, before calculating any saving.

Prompt caching reuses an eligible input prefix; it does not serve a previously generated answer. The earlier 167X statement was not a valid universal cache-saving claim. Consult Anthropic’s prompt-caching documentation for model-specific rates and conditions.

The Cache Pricing Gap Behind Google TPUs Anthropic Serving

Repeated system instructions can benefit from prompt caching when they meet the provider’s requirements. Batching is a separate technique whose throughput and latency tradeoffs should be measured on the actual workload.

For a cost estimate, separate cache-write tokens, cache-read tokens, uncached input and output, then apply the relevant rates. A lower bill for repeated input does not establish how many physical TPU-hours become available elsewhere.

Speculative decoding uses a smaller model to predict likely tokens, then the full model verifies them, meaningfully speeding up generation without adding chips. Quantization runs models at reduced precision, like INT8 instead of FP32, cutting memory usage and improving throughput — TPUs handle quantized workloads efficiently, which matters a lot at this scale.

More efficient inference can reduce compute needed for a given workload. Whether this releases capacity for another customer or an internal team depends on the provider’s allocation agreements and operating policy.

Anthropic’s October 2025 announcement described an expansion worth tens of billions of dollars, with up to one million TPUs and capacity expected online in 2026. Its April 2026 announcement described further Google/Broadcom capacity beginning in 2027. These are announced plans, not a disclosed measure of Google’s revenue recognized from Anthropic or internal research delays. 2025 announcement; 2026 expansion.

How Google TPU Anthropic Uses Affect Google’s Own Research

Google’s internal research and external cloud customers both need compute. A customer commitment alone does not show that either group lost access, since new capacity and separate reservations can also serve demand.

In a constrained shared pool, scheduling conflicts could delay training or experiments. Establishing that this happened to Google’s teams would require evidence about actual reservations, wait times and utilization, which the cited announcements do not provide.

Product teams, research projects and contracted customer workloads can have different priorities. Their relative allocation at Google is not established here; the capacity-planning discussion should be read as a scenario analysis.

Unpredictable compute access could create recruitment and retention problems. No evidence presented here establishes that particular Google researchers left because Anthropic displaced their workloads.

Similar allocation questions can arise for other providers that both develop models and supply customer compute. Investment figures alone do not show how those providers allocate hardware or whether particular teams experience delays.

Capacity Planning Questions for Google and Anthropic

Capacity planning must account for procurement, power, facilities and deployment lead times. The partnership announcements do not disclose a manufacturing schedule that would allow a precise forecast of when a particular internal queue will clear.

Scheduling, reservations and preemptible capacity are possible tools for managing utilization. The cited public announcements do not disclose Google’s internal job priorities or show that Google can reclaim Anthropic’s capacity when its workloads dip.

Additional capacity may reduce contention, but announced construction and future capacity are not the same as capacity currently available to a given team. Check the relevant availability dates and contract terms.

What Google TPU Anthropic Means for Cloud Competition

The Google TPUs Anthropic story reveals something deeper about AI infrastructure right now. Custom silicon is becoming a strategic weapon. Cloud partnerships are reshaping competitive dynamics, and the economics of AI serving will determine which companies are still standing in five years.

Custom silicon matters more than ever. Google’s TPUs, Amazon’s Trainium and Inferentia chips, and Meta’s MTIA accelerators all represent major bets on custom hardware, since general-purpose Nvidia GPUs are expensive and supply-constrained. Custom chips can be optimized for specific workloads and manufactured independently.

GPU and custom-accelerator options should be compared against delivered capacity, software compatibility and workload performance. Anthropic’s disclosed multi-platform approach does not establish that one chip family was unavailable or categorically unsuitable.

Cloud Provider AI Partner Investment Hardware Used Queuing Impact
Google Cloud Anthropic Cloud expansion announced October 2025; not an equity-investment comparison Google TPUs Not established by cited operational evidence
AWS Anthropic Investment and cloud commitments are different measures Trainium, Inferentia Not established by cited operational evidence
Microsoft Azure OpenAI Investment and cloud commitments are different measures NVIDIA GPUs Not established by cited operational evidence
Oracle Cloud xAI Earlier $10B claim not established here Do not infer allocation from an unverified deal Not established by cited operational evidence

How Google TPU Anthropic Compares to Other Cloud AI Deals

Cloud partnerships can combine investment, service commitments and infrastructure planning. These arrangements differ by agreement, so the presence of an investment should not be treated as proof of a particular cloud-consumption obligation.

Investment commitments, cloud-service contracts and infrastructure agreements are different measures. The figures above cannot establish which provider has the greatest internal queuing impact; that would require comparable operational data, which these announcements do not supply.

The general planning risk is a mismatch between committed demand and usable capacity. Whether a provider currently has that mismatch, and which customers are affected, requires operational evidence beyond a partnership announcement.

Moving a suitable workload onto a device could change its demand for cloud inference. The effect depends on model capability, device limits and usage; it does not establish relief for an unverified Google research queue.

Conclusion: What Google TPU Anthropic Reveals About AI Infrastructure

The TPU partnership is a way for Google to commercialize its infrastructure. Whether the associated capacity commitments help or hinder particular internal projects cannot be inferred from the deal size alone.

The partnership illustrates why buyers should examine hardware availability, workload economics and contract scope together. It does not show that TPUs won every Claude workload or displaced all other accelerators.

For an AI application, compare total request cost, measured latency and quality across suitable providers. Include cache behavior, output length, retries and reservation terms. Maintain a capacity fallback where the application’s reliability requirements justify it.

Treat capacity availability as an operating assumption to monitor, rather than a permanent shortage or a guaranteed future surplus. Revisit the comparison when actual prices, contracts or delivered capacity change.

FAQ About Google TPU Anthropic

Do the Announcements Establish a Google Research Queue?

Anthropic has publicly announced substantial TPU capacity commitments. Those announcements establish the partnership, but do not establish the article’s earlier claim that Google’s researchers are directly waiting behind Anthropic for the same hardware.

How Much Did Google Invest in Anthropic?

Google’s partnership with Anthropic combines investment, compute supply and model distribution. The UK Competition and Markets Authority’s 2024 decision describes the compute and Vertex AI distribution arrangements as non-exclusive. Anthropic also uses other providers, including AWS; the public evidence does not support treating the Google arrangement as an exclusive TPU requirement.

What Makes TPUs Better Than GPUs for Serving Claude?

Anthropic’s disclosed strategy uses TPUs, Trainium and NVIDIA GPUs. Capacity, cost and workload fit can inform a hardware comparison, but the cited announcements do not support saying H100s were categorically impractical for Anthropic. See the primary multi-platform statement above.

Is There a Universal Cache-Pricing Saving?

There is no universal 167X cache-saving ratio. Prompt caching reuses eligible input prefixes while output generation remains separately billed. Use the documented rates for the selected model and include cache writes, uncached input and output in the total.

What Could Additional Capacity Change?

Additional delivered capacity and more efficient inference could reduce contention in a shared pool. This article does not establish the existence, size or duration of a Google research queue attributable to Anthropic, so it cannot predict when such a queue would clear.

How Does Google TPUs Anthropic Affect Gemini Development?

Competition for a constrained pool could affect scheduling in principle. The cited sources do not establish delays to Gemini, Google’s internal priority rules or a causal link to Anthropic’s reservations. Those claims require separate operational evidence.

Colorado AI Act: What Changed and How to Prepare

Colorado AI Act compliance

Update checked 16 September 2026: the original “one month” framing and February 2026 deadline in this article are obsolete. Colorado’s framework has been replaced. The operational advice below must be read against the current law, not the superseded timetable.

SB25B-004 first delayed the original SB 24-205 requirements until 30 June 2026. SB26-189 subsequently repealed and reenacted the framework. The Attorney General’s current guidance identifies 1 January 2027 as the replacement provisions’ effective date.

This article explains the compliance workflow and identifies which earlier statements require correction. Company-adoption examples and cross-jurisdiction comparisons need separate evidence; they should not be treated as verified case studies merely because the legal timetable has been updated.

Key Takeaways on Colorado AI Act Compliance
  • The replacement SB26-189 provisions begin on 1 January 2027; the old February 2026 timetable is obsolete.
  • Vendor contracts, impact assessment templates, and internal governance teams are forming well ahead of the deadline.
  • Do not use the earlier unsupported per-consumer penalty extrapolation to estimate exposure.
  • Framework adoption can support governance; do not rely on the superseded reasonable-care defense.
  • Assess territorial scope and exemptions for the covered workflow; headquarters alone does not decide applicability.

What Colorado AI Act Compliance Actually Requires

The current framework concerns automated decision-making technology (ADMT) used to materially influence consequential decisions. Check the enacted definitions, territorial scope and exemptions for the actual workflow, rather than assuming every use of AI is covered.

Covered developers must provide technical documentation on intended uses, training-data categories, limitations and appropriate use/human review, and notify deployers of material changes. Developers and deployers retain compliance records for at least three years.

Deployers provide notice at interaction and, after adverse outcomes, a plain-language explanation within 30 days. Consumers can request their personal data, correction of inaccurate facts and meaningful human review and reconsideration. These current duties replace the earlier checklist stated here.

Developers and Deployers Under Colorado AI Act Compliance

The law distinguishes between developers and deployers, and a single company can be both. The obligations differ significantly depending on which role you occupy, and that dual-role complexity is where most Colorado AI Act compliance confusion actually lives.

Consider an insurtech company building and using an underwriting tool. It should assess both its developer and deployer roles: documentation supplied for a model and the notices/review process in a customer workflow are different operational tasks. This is a hypothetical workflow, not a finding that every insurer or system falls within the law.

The National Conference of State Legislatures tracks AI legislation across all 50 states, and Colorado AI Act compliance remains the most complete approach to date.

What Colorado AI Act Compliance Has Changed Operationally

So what’s genuinely different now? Colorado AI Act compliance one month in shows that things have actually changed, though not always in the ways people expected.

A practical preparation step is to draft a plain-language description of a system’s purpose, inputs, limitations and role in a decision. Treat this as a planning exercise until the applicable legal duty and start date are established; it is not evidence that required compliance filings have already begun.

Assessment work can require input from data science, product, legal and compliance. Teams can prepare by gathering their system documentation and testing how they would evidence a decision; this is a suggested workflow, not a verified account of particular HR or fintech firms.

Procurement teams can request the documentation needed to assess a vendor’s system and allocate responsibilities in the contract. Check the current statutory requirements before describing any clause as mandatory.

A useful governance plan names accountable people in legal, engineering and product and provides training relevant to their roles. This is a preparation recommendation rather than a claim that particular employers have already implemented it.

What Hasn’t Changed Yet in Colorado AI Act Compliance

Rulemaking is underway: the Attorney General filed proposed rules on 11 August 2026 and invited formal comments through 26 October 2026. Proposed text is not final law. Follow the rulemaking docket for adopted implementing rules rather than assuming guidance does not exist.

Colorado AI Act Compliance: Enforcement and Penalties

Understanding enforcement is critical. How penalties actually work determines whether Colorado AI Act compliance has real teeth, and it does.

The Attorney General enforces the replacement through the Colorado Consumer Protection Act. SB26-189 creates no new private right of action; that does not extinguish rights under other existing laws.

A violation is treated as a deceptive trade practice. The earlier per-applicant multiplication of a $20,000 figure was not an established penalty calculation and should not be used to budget legal exposure. Check applicable remedies and facts with qualified counsel.

The Affirmative Defense in Colorado AI Act Compliance

The earlier discussion of a reasonable-care affirmative defense described the superseded framework. Under the replacement, before 1 January 2030 a violation deemed possible to cure receives 60 days’ notice and an opportunity to cure before an enforcement action. Do not confuse that provision with blanket immunity.

The NIST AI Risk Management Framework can be useful for organizing internal controls. Adopting a framework is an operational choice, not proof of compliance or a substitute for the replacement law’s actual duties.

If you adopt a governance framework, keep records showing how it changes decisions, tests and incident handling. A policy document alone does not demonstrate that a control works.

Penalty Element Details
Enforcing body Colorado Attorney General
Private right of action No
Penalty per violation Check applicable Consumer Protection Act remedies; no automatic per-consumer estimate
Affirmative defense available Do not rely on the superseded framework; see current notice/cure provision
Framework alignment recommended NIST AI RMF
Effective date 1 January 2027
Pre-enforcement guidance Proposed rules filed 11 August 2026; monitor final rules
Current operational duties Documentation, records, notices, data correction and review; see current scope

Legal disruption can extend beyond a budgeted fine. The practical reason to test notices, documentation and review processes is to identify failures before a regulator or affected consumer does; the remedy in an actual case depends on applicable law and facts.

Colorado AI Act Compliance Case Studies: Early Movers vs. Wait-and-See

Published vendor governance material can help a customer understand how a system is documented. It does not by itself prove compliance with Colorado law.

Workday describes responsible-AI governance and machine-learning fact sheets in its published governance explanation. That provides a concrete example of vendor transparency material. It does not establish that Workday exceeds every current Colorado requirement or that the disclosure was made to satisfy that law.

Customers using third-party AI tools should examine the actual service terms and documentation. A vendor’s general AI commitment is not proof that its contract covers every duty of a particular deployer.

One pattern worth noting: early movers use Colorado AI Act compliance as a forcing function to clean up documentation debt accumulated over years. A company that maps its training data sources to meet Colorado’s disclosure requirements often finds that same documentation helps it answer security questionnaires faster, satisfy EU AI Act requirements, and onboard new engineers more efficiently.

A team should not postpone applicability work simply because it is headquartered elsewhere or assumes its system is outside scope. Start with the actual decision workflow and statutory definitions.

This wait-and-see approach carries real risk. Impact assessments take months to complete properly, and vendor documentation requirements mean you can’t comply overnight. The companies starting now will be ready; delaying until the applicable start can leave too little preparation time — the same story played out with GDPR and CCPA, and here we are again.

The “our AI doesn’t make consequential decisions” assumption deserves scrutiny. Product leaders who believed their tool was just a dashboard have discovered, after walking through the decision flow, that a hiring manager’s final call was almost entirely driven by a ranked list the AI generated. The AI didn’t technically decide, but it substantially contributed — and under Colorado AI Act compliance rules, that distinction may not protect you.

The Geographic Trap in Colorado AI Act Compliance

Being headquartered outside Colorado does not by itself resolve applicability. Assess the covered workflow, affected residents and statutory scope/exemptions. Do not assume that every company with a Colorado customer is automatically subject to every ADMT duty.

Your Colorado AI Act Compliance Checklist

Colorado AI Act compliance work that actually matters must be concrete and measurable. Here’s a practical checklist organized by role, since specificity is what separates useful checklists from decorative ones.

For in-house counsel: inventory the workflows, assess covered ADMT and consequential decisions, and identify developer/deployer roles and exemptions. Map each current statutory duty to an owner and evidence record. NIST AI RMF or ISO 42001 may help organize that work, but neither should be presented as an automatic legal defense.

For internal assurance, document intended use, affected groups, limitations, measured disparities and mitigations. Obtain current vendor documentation and define escalation responsibilities. These are recommended preparation controls; the old 90-day reporting/assessment checklist should not be treated as SB26-189’s duties.

For product teams: audit your models and document training data sources, known limitations, and performance metrics across demographic groups. Build consumer notification flows using UX patterns that tell users when AI makes consequential decisions about them — a plain-language banner works as a starting point, but test it with real users to confirm they understand it.

Design correction and meaningful human-review workflows for applicable adverse decisions. Monitor outcomes and version model and governance records. Do not describe this as a universal opt-out right without checking the relevant provision.

A Colorado AI Act Compliance Timeline

Recommended preparation sequence: start with system inventory and applicability, then obtain vendor documentation and test notices and review workflows. Give each task an owner and evidence requirement; these are planning steps, not the obsolete 2025 statutory deadlines.

Prepare for the applicable duties starting 1 January 2027 and monitor the final rulemaking outcome. Team training and documentation reviews should support those duties, rather than the superseded February 2026 checklist.

Keep the program current when models, intended uses or material limitations change. Schedule internal reviews appropriate to the risk; do not attribute the old blanket impact-assessment timetable to the replacement law.

Action Item Recommended Deadline Priority
AI system inventory Preparation before applicable January 2027 duties Critical
Risk framework adoption Preparation before applicable January 2027 duties Critical
Impact assessment completion Preparation before applicable January 2027 duties High
Vendor contract updates Preparation before applicable January 2027 duties High
Consumer notification design Preparation before applicable January 2027 duties Medium
Public transparency statements Preparation before applicable January 2027 duties Medium
Team training completion Preparation before applicable January 2027 duties High
Current-duty readiness 1 January 2027 Critical

How Colorado AI Act Compliance Compares to Other Regulations

Understanding Colorado AI Act compliance requires broader context. Has anything actually changed in the wider regulatory environment? Absolutely, and the comparison is genuinely instructive.

Feature Colorado SB26-189 EU AI Act NYC Local Law 144
Scope Covered ADMT materially influencing consequential decisions All AI by risk tier Employment decisions only
Applies to developers Yes Yes No
Applies to deployers Yes Yes Yes
Impact assessments required Do not carry over the old blanket requirement Yes (high-risk) Yes (bias audits)
Consumer notification Yes Yes Yes
Private right of action No Limited No
Affirmative defense Do not rely on superseded reasonable-care defense No No
Effective date January 2027 Phased through 2027 July 2023

The European Union’s AI Act takes a tiered approach based on risk levels. Colorado’s law is narrower, focusing on consequential decisions rather than sorting all AI by risk tier, though transparency is important in both frameworks; their assessment duties should not be assumed identical. One concrete difference: the EU AI Act requires conformity assessments for certain high-risk systems before market placement, a pre-market gate Colorado’s law doesn’t replicate.

State and local AI rules address different systems and conduct. New York City Local Law 144, for example, addresses specified automated employment decision tools. Comparing such a rule with Colorado’s ADMT framework requires checking scope and exceptions rather than ranking one as universally more comprehensive.

Colorado AI Act Compliance vs. the EU AI Act

Federal and state obligations must be checked separately. Executive-order policy statements, agency rules and statutes have different legal effects, and an older executive order should not be treated as a current private-sector compliance rule.

Some industry groups are pushing for federal preemption, arguing that a patchwork of state laws creates impossible compliance burdens. A single federal standard would reduce compliance costs for companies operating nationally, but it would likely produce a weaker baseline than Colorado AI Act compliance already requires. Do not assume future preemption removes currently applicable obligations.

Conclusion: What Colorado AI Act Compliance Means for You

The most important change is legislative: SB26-189 replaced the earlier framework. Reconcile the controls and dates in a compliance plan against that enacted text and the forthcoming final rules before relying on the plan.

The operational shifts are real. Vendor contracts now include AI compliance clauses, impact assessments are being drafted, and governance structures are forming. These changes aren’t theoretical — they’re happening in procurement offices and engineering standups right now.

Start with the AI system inventory and decision map, obtain the documentation vendors must supply, and build cross-functional ownership. Preserve evidence of the actual controls. Do not rely on the old February 2026 deadline or reasonable-care defense.

Preparation is useful even before an applicable duty begins. The practical test is whether a team can identify its covered systems, explain their role in decisions and produce the evidence required by the current law.

FAQ About Colorado AI Act Compliance

Does Colorado AI Act Compliance Apply Outside Colorado?

Check the enacted law’s scope and exemptions against the covered workflow and affected Colorado residents. Headquarters alone does not settle applicability; a blanket statement covering every AI system or every business would be too broad.

What Qualifies as a High-Risk AI System Under Colorado AI Act Compliance?

The replacement uses covered ADMT that materially influences consequential decisions. The enacted definition includes education, employment, housing, financial or lending services, insurance, healthcare, and essential government services/public benefits. A ranking or recommendation can matter even where a human makes the final decision.

What’s the Colorado AI Act Compliance Deadline?

The Attorney General states that the replacement provisions take effect on 1 January 2027. The previous February 2026 answer is obsolete. Check the current rulemaking page for implementing rules and distinguish proposed rules from adopted requirements.

Can Consumers Sue Under Colorado AI Act Compliance Rules?
No. Colorado’s AI Act gives exclusive enforcement authority to the Colorado Attorney General and doesn’t include a private right of action. Consumers can’t file their own lawsuits under this law, though they can file complaints that may prompt an AG investigation. That concentration of enforcement power is a deliberate design choice meant to prevent a flood of private litigation.

Apple and Amazon AI Spending: What the Filings Show

Apple Amazon AI spending

Comparing Apple and Amazon’s AI investment starts with an accounting problem: neither a company-wide spending line nor a supplier commitment automatically measures AI-only expenditure. A useful comparison separates disclosed figures from estimates.

The companies discuss different businesses and spending categories. A cloud-infrastructure budget, device development costs and purchase obligations cannot be added or ranked as if they were the same measure. Related reading: AI infrastructure budget.

This article examines the limits of an Apple–Amazon spending comparison. The disclosures discussed here do not establish that Apple spends more on AI than Amazon or its other competitors.

Key Takeaways on Apple Amazon AI Spending
  • Apple Amazon AI spending diverges sharply in style: Apple stays silent, Amazon is loud about AWS but quiet everywhere else.
  • Apple’s SEC filings show over $53 billion in purchase obligations, much of it tied to chip fabrication and AI hardware.
  • Amazon projected $100 billion in 2025 capex, mostly for AWS infrastructure and Trainium chips.
  • Conservative estimates put Apple’s own AI-related spending at $34–51 billion a year, rivaling Microsoft and Meta.
  • Apple’s on-device AI model is margin-accretive; Amazon’s cloud model spends more but scales differently.

Decoding Apple Amazon AI Spending: What the Filings Reveal

Apple’s financial statements provide a starting point, but they do not turn every hardware or research expense into an AI-specific investment.

Apple reported $9.447 billion in payments for acquisition of property, plant and equipment for fiscal 2024, not $9.9 billion. That is a company-wide cash-flow figure, not an AI-only budget. See Apple’s fiscal 2024 financial statements.

Purchase obligations measure contractual commitments. They cannot be treated as current-year cash expenditure or attributed to AI without a disclosed breakdown and a consistent accounting period.

The Hidden Numbers Behind Apple Amazon AI Spending

The earlier $15–20 billion annual custom-silicon estimate did not include a reproducible allocation model. It should not be treated as a disclosed Apple AI-spending figure.

Apple develops device silicon and AI services, but estimating the AI share requires more than identifying a chip or a data-center project. The same assets can support multiple functions.

On-device processing and cloud services have different cost structures. Device installed base is not the same as the number of devices eligible for a particular Apple Intelligence feature.

For an on-device task, computation uses the device’s hardware and power; cloud tasks also use server infrastructure. Neither approach is cost-free. The processing location depends on the feature and supported device, so do not assume every Siri request runs entirely on the Neural Engine.

Apple Amazon AI Spending: Amazon Loud on AWS, Quiet Everywhere Else

Amazon presents its own version of the quiet-company paradox in the Apple Amazon AI spending story. AWS dominates cloud AI conversations, and Andy Jassy talks enthusiastically about Bedrock, Trainium chips, and generative AI services. Amazon’s consumer AI spending, though, remains surprisingly opaque, even by Big Tech standards.

Amazon’s company-wide capital expenditure and AWS infrastructure spending should be compared for a named reporting period. A projected 2025 figure is historical guidance, not a verified current AI-only expenditure total.

Custom accelerators can change a provider’s cost structure, but comparing a quoted GPU sale price with a guessed chip manufacturing cost omits design, software, infrastructure and utilization costs.

Amazon also uses AI in consumer and logistics businesses. Without a disclosed allocation, these activities do not yield a defensible AI-only investment total.

Robotics can require computer vision, planning and supporting infrastructure. A fleet-size claim needs a dated source and does not by itself establish the expenditure attributable to AI.

An equity investment in another AI company is different from capital expenditure on infrastructure. Keep investments, purchase commitments and operating costs separate when comparing Apple and Amazon.

Apple Amazon AI Spending Compared Across the Industry

Understanding Apple Amazon AI spending requires comparing approaches across the whole industry, and the differences are striking.

Company AI-only amount established here Reporting caution Approach discussed Hardware examples
Apple Not separately established Company-wide PP&E/R&D are not AI-only Device and cloud A-series and M-series
Amazon Not separately established Company-wide capex is not an AI-only total Cloud and consumer Trainium and Inferentia
Microsoft Not compared on a matched basis Use a named fiscal period and scope Cloud services Check current product disclosures
Meta Not compared on a matched basis Separate guidance from realized expenditure Models and infrastructure MTIA
Google Not compared on a matched basis Separate guidance from realized expenditure Cloud and consumer TPUs

The table separates business approaches rather than ranking AI expenditure. Apple’s earlier $30–40 billion estimate was not a disclosed capex figure, and it was not comparable to company-wide guidance from cloud providers.

A defensible numeric comparison would use the same period, cash-versus-accrual basis and category for each company. AI-specific estimates need a separate model with assumptions and possible double counting identified.

Apple does not provide the AI-only total needed to support the claim that it matches or exceeds competitors’ spending. That remains unestablished by the figures in this article.

Communication choices can influence attention, but a difference in publicity is not evidence of equal expenditure. Compare the original filings before drawing that conclusion.

A supplier or research-spending line can inform an investment question without answering it. Do not infer an AI-specific total from the company’s communication style.

Why Apple’s Silence Is a Strategy in the Apple Amazon AI Spending Story

A quieter communication style is not enough to establish whether a company leads or lags in AI. Product capability, adoption and economics require their own evidence.

Product announcements and research disclosures reveal different information. Evaluate the specific announcements and delivery dates rather than assuming Apple never previews a capability.

What Apple Amazon AI Spending Silence Actually Protects

Supplier capacity commitments can matter, but the earlier claim about a complete 3nm production run booked eighteen months ahead was not substantiated here. Contract details and allocation to AI should not be guessed.

Markets react to many factors. This article does not establish that a particular AI-spending announcement caused a stock-price movement or that Apple received less market credit for comparable spending.

Apple’s WWDC 2024 keynote revealed Apple Intelligence as a complete AI platform, a milestone in the Apple Amazon AI spending story. That single announcement represented years of quiet infrastructure investment finally becoming visible. The on-device processing required custom silicon that took half a decade to develop.

Apple’s ChatGPT integration illustrates that product strategy can include a partner as well as internally developed technology. An announcement date is not necessarily a shipping date.

Reverse-Engineering the Real Apple Amazon AI Spending Numbers

Getting specific about where Apple’s money goes in the Apple Amazon AI spending story means following the supply chain, well beyond the earnings transcript.

Supplier disclosures may provide context on semiconductor demand. They do not, without additional evidence, identify how much of Apple’s orders is attributable to AI or establish a public AI-only wafer budget.

Wafer costs, yields and package contents vary by process and contract. The earlier $20,000-versus-$10,000 estimates lacked a specified source and cannot support an Apple AI-spending calculation.

Data center buildout is accelerating quietly too. Apple’s services revenue now exceeds $100 billion annually, and supporting Apple Intelligence, iCloud, and Siri at that scale requires enormous server infrastructure. Reports point to facilities across Iowa, North Carolina, Nevada, and Oregon, and Apple has begun deploying its own server-grade chips inside them.

A Breakdown of Apple Amazon AI Spending by Category

Apple’s fiscal 2024 research and development expense was $31.370 billion across the company. The financial statements do not provide the earlier claimed 40–60% AI allocation. Fiscal 2024 statements.

A bottom-up model would need mutually exclusive categories, dated quantities and prices, and an explicit allocation of shared costs. Without those inputs, adding guessed silicon, infrastructure, research, acquisition and ecosystem amounts creates a misleading total.

The earlier $34–51 billion total and top-three-spender ranking are not established. They should not be used as conclusions from Apple’s filings.

To track spending, record the reporting period and definition of each line item directly from the filing. Compare like with like and keep purchase obligations separate from cash expenditure.

What Earnings Disclosures Can and Cannot Establish

Read the actual earnings release and filing for a named reporting period. The earlier statement that both companies report “today” was undated and should not be used as an earnings-calendar claim.

For Amazon, distinguish reported results from future capital-expenditure guidance and from management commentary about the purpose of investment.

For Apple, record what is disclosed and leave the AI allocation unquantified where the company does not provide it. Silence is not a numerical estimate.

A reference to Private Cloud Compute identifies part of Apple’s architecture, but it does not disclose the amount spent on it. Product and privacy descriptions should not be converted into financial totals.

Gross-margin movement alone cannot isolate the profitability of on-device AI. Product mix, pricing, input costs and many other factors can change the reported margin.

Conclusion: What Apple Amazon AI Spending Really Tells Investors

Apple and Amazon pursue different combinations of device and cloud AI. The disclosed figures here do not establish an Apple AI-only annual spend or a spending winner. The useful comparison is one that keeps reported amounts separate from assumptions.

For investors, the takeaway is specific: don’t confuse communication strategy with investment strategy. Track Apple’s purchase obligations in SEC filings, monitor TSMC’s capex plans, and watch for data center land acquisitions. These signals tell you more than any earnings call ever will.

Developers should check the supported hardware, operating-system version and feature requirements for an on-device deployment. A company’s overall installed base is not an addressable feature-eligible audience.

Use current filings for financial decisions and current product documentation for deployment decisions. A communication strategy is not a substitute for either.

FAQ About Apple Amazon AI Spending

Why Are Apple and Amazon Both Reporting Apple Amazon AI Spending Numbers Today?

Check each company’s investor-relations earnings calendar for the specific quarter. This article does not establish that Apple and Amazon report on the same day.

How Much Is Apple Actually Spending on AI Infrastructure?

Apple does not disclose an AI-only expenditure total in the statements cited here. The earlier $30–50 billion figure was an unsupported allocation estimate, not a reported result.

Why Doesn’t Apple Talk About Apple Amazon AI Spending Like Microsoft or Meta Do?

Apple makes both product announcements and advance disclosures. Its communication style cannot establish an AI budget or a lead over another company.

Is Amazon’s Side of Apple Amazon AI Spending Mostly Through AWS?

Amazon’s infrastructure investment, consumer operations and strategic investments are different categories. A single AI-only total requires a disclosed and consistent allocation that this article does not establish.

What Should Investors Watch for in Apple Amazon AI Spending Disclosures Today?

Start with the exact financial statement, reporting period and definition. Use product or supplier announcements as context, while keeping any inference about AI-specific spending explicit.

Could Apple’s On-Device Model Beat Amazon’s in the Apple Amazon AI Spending Race?
It’s possible, at least for certain workloads. Apple’s on-device model eliminates per-query cloud costs; Amazon’s server-based approach scales differently. Whether it beats Amazon’s model depends on the use case — cloud AI still wins for training and heavy compute, while on-device AI wins for cost efficiency and privacy at massive scale. That’s the real center of the Apple Amazon AI spending debate.

Exclusive: The Hidden Risks of AI Jailbreak Bug Bounties

AI jailbreak bug bounty

Should every AI lab run an AI jailbreak bug bounty program the way traditional software companies handle security bounties? That question is genuinely splitting the AI safety community right now, and it’s been building for the better part of two years.

Some researchers argue an AI jailbreak bug bounty is the fastest path to safer models. Others warn it’s basically handing attackers a detailed playbook.

The stakes are high. Frontier models from Anthropic, OpenAI, Google DeepMind, and Meta power millions of applications, and a single jailbreak can expose harmful content generation at massive scale. How labs handle an AI jailbreak bug bounty matters more than most people outside the safety community realize.

This piece unpacks the real tradeoffs: how leading labs structure their programs, what researchers actually earn, and when bounties help versus when they backfire.

Key Takeaways on AI Jailbreak Bug Bounty Programs
  • An AI jailbreak bug bounty targets model behavior, not code — a fundamentally different problem than traditional security bugs.
  • Anthropic, OpenAI, and Google DeepMind each run one with very different scope and payouts; Meta relies on open-weight crowdsourcing instead.
  • Proponents say an AI jailbreak bug bounty finds blind spots internal teams miss and channels researchers toward responsible disclosure.
  • Critics warn it can map attack surface faster than labs can patch it, and may attract bad-faith submissions.
  • A strong AI jailbreak bug bounty scores 12+ out of 18 on scope, severity, response time, payout transparency, transfer testing, and researcher feedback.

Why AI Jailbreak Bug Bounty Programs Matter Right Now

Traditional software bug bounties have existed for decades. HackerOne alone has paid out over $300 million total. But an AI jailbreak bug bounty is fundamentally different from finding a buffer overflow or SQL injection, and conflating the two is where a lot of confusion starts.

Jailbreaks target behavior, not code. A traditional vulnerability exploits a flaw in software logic; a jailbreak exploits gaps in a model’s alignment training. That distinction changes everything about how an AI jailbreak bug bounty should score severity and deploy fixes.

The Forces Accelerating AI Jailbreak Bug Bounty Adoption

Several forces are pushing labs toward running an AI jailbreak bug bounty right now.

  • The EU AI Act requires high-risk AI systems to undergo adversarial testing before deployment, so labs can’t ignore this anymore.
  • Open-weight models add pressure too. When Meta releases Llama weights publicly, jailbreaks discovered on closed models often transfer directly. More capable models raise the stakes further — a jailbroken GPT-2 was a curiosity, while a jailbroken GPT-4-class model is a genuine risk.
  • Community expectations matter as well. Security researchers expect compensation, and without a formal AI jailbreak bug bounty, they’ll publish findings on social media instead. They already do.
  • An AI jailbreak bug bounty isn’t purely theoretical anymore. Multiple labs have launched programs — the real question is whether their designs actually work.

How Anthropic, OpenAI, and Google Structure AI Jailbreak Bug Bounty Programs

Not every AI jailbreak bug bounty is built the same way. The differences between Anthropic’s, OpenAI’s, and Google’s approaches reveal fundamentally different philosophies about adversarial testing, with real consequences for what gets found.

Anthropic runs a tiered AI jailbreak bug bounty through partners like HackerOne. It separates traditional security vulnerabilities from model behavior issues, invites researchers to test constitutional AI guardrails, and scales payouts with severity. Getting into the program isn’t trivial, though.

OpenAI launched its bug bounty through Bugcrowd in April 2023. That program initially excluded model jailbreaks and prompt injections entirely, focusing instead on API security, data leaks, and authentication. OpenAI has since expanded red-teaming through separate efforts, and its preparedness framework now covers catastrophic risk evaluation.

Google folds its AI jailbreak bug bounty into a broader Vulnerability Reward Program that already handles thousands of submissions a year. That existing infrastructure gives Google a real head start over labs building from scratch.

Meta takes the most different path of all. By releasing model weights publicly, it effectively crowdsources adversarial testing instead of running a formal AI jailbreak bug bounty. Jailbreaks often surface publicly before any coordinated disclosure happens — great if you’re a researcher chasing clout, a real problem if you’re trying to manage harm.

Feature Anthropic OpenAI Google DeepMind Meta
Formal bounty program Yes Yes (limited AI scope) Yes (integrated) Limited
Jailbreaks in scope Tiered inclusion Initially excluded Expanding N/A (open weights)
Payout range Up to $15,000+ $200–$20,000 $100–$31,337+ Varies
Disclosure timeline Coordinated Coordinated 90-day standard Public by default
Red-team partnerships Yes Separate program Yes Community-driven
Model behavior bugs Accepted Evolving Expanding N/A
Where AI Jailbreak Bug Bounty Programs Differ Most

Anthropic’s payouts run up to $15,000-plus, with jailbreaks in tiered scope and coordinated disclosure. OpenAI pays $200 to $20,000, though jailbreaks were initially excluded and are only now expanding into scope.

Google’s program can pay over $31,000 for severe issues, with jailbreak scope expanding and a 90-day standard disclosure timeline. Meta’s compensation varies since it has no formal program, relying on public, community-driven disclosure instead.

This comparison highlights a core tension in the AI jailbreak bug bounty debate: should jailbreaks be treated like security bugs, or do they need entirely different frameworks? It’s closer to the latter, but most labs are still trying to force the former.

The Case For AI Jailbreak Bug Bounty Programs

Proponents make several compelling arguments, and real-world evidence actually backs up many of their claims.

  • An AI jailbreak bug bounty finds what internal teams miss. Internal red teams, however talented, carry institutional blind spots — they know how the model was trained and what the safety team worried about. External researchers bring genuinely fresh attack vectors, and Anthropic’s program has reportedly surfaced jailbreak categories its internal team hadn’t considered.
  • Financial incentives beat moral appeals. Telling researchers to disclose responsibly without compensation doesn’t work, and it never has in traditional security either. A structured AI jailbreak bug bounty channels researcher effort toward responsible disclosure instead of social media clout.
  • An AI jailbreak bug bounty also creates documentation. Every submitted jailbreak becomes a training signal labs can use to fine-tune model behavior, build automated detection, develop evaluation benchmarks, and create adversarial training datasets.
  • Public programs signal commitment too. A lab running a transparent AI jailbreak bug bounty shows accountability. Regulators notice, and customers building on these APIs gain confidence that adversarial risks are being actively managed.
  • Speed matters as well. Models ship fast, and jailbreaks spread fast. An AI jailbreak bug bounty with clear submission channels gets critical findings to safety teams in hours, not weeks, while informal disclosure through blog posts gives attackers a head start.
Real Evidence Behind AI Jailbreak Bug Bounty Success

Security researcher Pliny the Prompter, known for jailbreaking multiple frontier models, has publicly argued that structured programs would improve the entire ecosystem. The alternative — researchers racing to publish jailbreaks for followers — serves nobody well. That dynamic plays out repeatedly, and it isn’t pretty.

The Case Against AI Jailbreak Bug Bounty Programs

The counterarguments are serious and not easily dismissed, even for someone who generally supports well-designed programs.

  1. Jailbreaks aren’t traditional bugs. A software vulnerability either exists or it doesn’t; jailbreaks exist on a spectrum instead. A prompt that extracts mildly inappropriate content differs enormously from one that generates weapons instructions, so severity scoring in an AI jailbreak bug bounty becomes subjective and contentious.
  2. Disclosure creates proliferation risk. In traditional security, a patched vulnerability is neutralized. AI jailbreaks don’t work that way — patching one prompt variation often leaves dozens of similar approaches still viable. An AI jailbreak bug bounty creates a real paradox: the more jailbreaks you collect, the more attack surface you’ve mapped out.
  3. Bounties attract the wrong crowd sometimes. Not every participant has good intentions, and bad actors can submit low-severity findings while keeping critical jailbreaks for other purposes. Screening participants for an AI jailbreak bug bounty is considerably harder than screening traditional security researchers.
  4. Payout economics don’t fully work yet. A researcher who spends 40 hours developing a novel jailbreak might earn $5,000 from an AI jailbreak bug bounty, or sell the technique privately, publish a paper, or consult at higher rates instead. Until payouts reflect true value, programs will struggle to attract top talent.
The Legal and Economic Limits of AI Jailbreak Bug Bounty Programs

The “whack-a-mole” problem is real too. Fixing individual jailbreaks doesn’t address root causes, and critics argue an AI jailbreak bug bounty can create an illusion of safety while deeper alignment problems persist unaddressed.

Legal gray areas remain as well. The Computer Fraud and Abuse Act still creates uncertainty for security researchers in the United States. Most AI jailbreak bug bounty programs include safe harbor provisions, but the legal framework for AI-specific adversarial testing remains genuinely underdeveloped.

None of this means labs shouldn’t run an AI jailbreak bug bounty. It means the design demands real care, which not everyone is putting in.

A Framework for Evaluating Any AI Jailbreak Bug Bounty Program

How should you assess whether a specific AI jailbreak bug bounty actually catches critical vulnerabilities before deployment? Here’s a practical framework built from watching these programs evolve.

Scope clarity matters first. An AI jailbreak bug bounty must clearly define what counts as a jailbreak versus expected model behavior. Vague scope floods queues and frustrates researchers; effective programs publish detailed taxonomies of in-scope attacks.

Severity calibration comes next. A strong AI jailbreak bug bounty uses a calibrated scale: critical findings enable content that could cause real-world physical harm, high findings bypass safety training consistently across versions, medium findings need highly specific scenarios, and low findings produce mildly off-policy content with limited harm.

Response commitments matter too. The best AI jailbreak bug bounty programs publish and honor real timelines — acknowledgment within 48 hours, severity assessment within 7 days, a mitigation plan within 30 days, and researcher notification once a fix ships.

Payout transparency builds trust. Labs should publish payout ranges by severity tier, and sharing aggregate statistics on submissions received, accepted, and resolved compounds community trust over time.

Transfer testing is a no-brainer step too many skip. When a jailbreak appears on one model, does the lab test it against other models in the family? Cross-model transfer testing in an AI jailbreak bug bounty catches systemic vulnerabilities that single-model fixes miss.

Feedback loops close the process. The best programs tell researchers what happened with their submission. Programs that swallow submissions into a black box lose researcher engagement fast, then wonder why submission quality drops.

Criterion Strong Program (3 pts) Adequate (2 pts) Weak (1 pt)
Scope definition Published taxonomy General guidelines Vague or missing
Severity scoring Calibrated scale with examples Basic tiers Ad hoc decisions
Response time Published SLAs Informal targets No commitments
Payout structure Transparent ranges Private negotiations Inconsistent
Transfer testing Systematic Occasional None
Researcher feedback Detailed updates Basic status Silent
A Quick Scoring Rubric for AI Jailbreak Bug Bounty Programs

Score each criterion from 1 to 3 points: scope definition, severity scoring, response time, payout structure, transfer testing, and researcher feedback. A published taxonomy, calibrated scale, published SLAs, transparent ranges, systematic transfer testing, and detailed feedback each earn 3 points; vague, ad hoc, or silent handling earns 1.

An AI jailbreak bug bounty scoring 12 or higher out of 18 is likely strengthening safety. Below 8, it’s probably theater, and unfortunately more programs fall in that lower range than labs would care to admit.

What Researchers Experience in an AI Jailbreak Bug Bounty Program

The researcher perspective often gets overlooked in the AI jailbreak bug bounty discussion, and it’s arguably the most important part.

Submission friction varies wildly. Some programs accept a simple proof-of-concept prompt; others require detailed write-ups, reproduction steps, and full impact analysis. That overhead matters, since researchers with day jobs won’t spend eight hours documenting a finding for a $500 AI jailbreak bug bounty payout.

Duplicate handling frustrates everyone. Popular jailbreak techniques get submitted by dozens of researchers at once, and programs that don’t communicate duplicate status quickly waste researcher time and create lasting community tension.

Scope disputes are common too. A researcher submits what they consider a critical jailbreak, and the lab classifies it as expected behavior or out of scope. Without clear appeals, these disputes erode trust in an AI jailbreak bug bounty permanently.

What the Best AI Jailbreak Bug Bounty Experiences Look Like

The best experiences share common traits: fast initial acknowledgment, clear communication about severity, fair compensation relative to effort, credit in security advisories, and an invitation to test fixes before public deployment.

Several prominent AI security researchers have shifted from public jailbreak demonstrations to private disclosure specifically because a structured AI jailbreak bug bounty gave them a better path. That behavioral shift alone validates the approach.

The worst experiences share recognizable patterns too: weeks of silence, arbitrary scope exclusions applied retroactively, payouts far below the effort required, no feedback on whether a finding was useful, and legal threats for discussing the experience publicly. These patterns actively harm safety — researchers who feel burned warn others away, and the community is small enough that reputation spreads fast.

Conclusion: Should Your Lab Run an AI Jailbreak Bug Bounty?

An AI jailbreak bug bounty isn’t a simple yes-or-no question. It’s fundamentally a design challenge. Poorly structured programs waste resources and risk weaponizing the very attacks they aim to prevent; well-designed ones genuinely catch critical vulnerabilities before they cause real harm.

For AI labs considering a program:

  • start with a clearly scoped pilot focused on high-severity jailbreaks,
  • publish a detailed taxonomy of in-scope attacks upfront,
  • set payouts that reflect genuine researcher effort,
  • commit to response timelines and honor them,
  • and build transfer testing into remediation from day one.

For security researchers:

  • evaluate any AI jailbreak bug bounty using the framework above before investing time,
  • document findings thoroughly to avoid scope disputes,
  • prefer programs with published safe harbor provisions,
  • and build relationships with lab safety teams beyond one-off submissions.

For policymakers:

  • encourage standardized AI jailbreak bug bounty frameworks across the industry,
  • clarify legal protections for adversarial researchers,
  • and require transparency reporting from labs running these programs.

An AI jailbreak bug bounty will only grow more important as models become more capable. Labs that get this right will build genuinely safer systems; those that don’t will learn the hard way, through public embarrassment, regulatory action, or worse.

FAQ About AI Jailbreak Bug Bounty Programs

What Exactly Is an AI Jailbreak Bug Bounty?

An AI jailbreak bug bounty is a structured program where AI labs pay researchers to find prompts or techniques that bypass a model’s safety guardrails. Unlike traditional bounties that target code, it focuses on model behavior — proving a model will produce content it was trained to refuse — and the lab uses those findings to improve safety training.

How Much Do AI Jailbreak Bug Bounty Programs Typically Pay?

Payouts vary significantly across labs. OpenAI’s Bugcrowd program offers $200 to $20,000, though AI-specific behavioral findings were historically out of scope. Anthropic’s AI jailbreak bug bounty has offered up to $15,000 or more for critical findings, and Google’s program can pay over $31,000 for severe issues. Most jailbreak submissions, though, fall in the $500 to $5,000 range.

Can an AI Jailbreak Bug Bounty Actually Make Models Less Safe?

Yes, under certain conditions. A poorly designed AI jailbreak bug bounty can create detailed catalogs of attack techniques that leak or spread more broadly, and programs that attract bad-faith participants may inadvertently fund adversarial research. Most security experts still argue structured disclosure beats the alternative: uncoordinated public disclosure where anyone can see the findings immediately.

How Does an AI Jailbreak Bug Bounty Differ From a Traditional Software Bounty?

The differences are fundamental. Traditional bugs are binary — they exist in code and get patched definitively. An AI jailbreak bug bounty targets probabilistic model behavior instead, where fixing one prompt variation doesn’t guarantee similar variations stop working. Severity assessment is also far more subjective, since a jailbreak’s impact depends on how generated content might be misused.

Which AI Labs Currently Run an AI Jailbreak Bug Bounty?

Anthropic runs a structured AI jailbreak bug bounty through HackerOne that includes model behavior issues. OpenAI operates a Bugcrowd program focused mainly on API and platform security, with expanding AI-specific scope. Google includes generative AI in its broader Vulnerability Reward Program. Meta doesn’t run a traditional bounty for its open-weight models but supports community red-teaming instead.

Should Smaller AI Companies Run an AI Jailbreak Bug Bounty Too?

It depends on resources and risk profile. A company deploying a fine-tuned model in a sensitive domain like healthcare or finance should consider adversarial testing. A full AI jailbreak bug bounty may be impractical for small teams, though — alternatives include partnering with AI safety organizations, hiring red-team consultants, or joining frameworks like NIST’s AI Risk Management Framework.

Figure vs Optimus: The Ultimate Battle for AI Robotics

Figure AI vs Optimus

The race to build humanoid robots at scale just split into two distinct lanes. Figure AI vs Optimus is the clearest divergence yet in how companies plan to manufacture humanoids, and the gap is wider than most people realize.

In the Figure AI vs Optimus split, one company embeds itself inside an automotive giant’s existing infrastructure. The other builds everything under its own roof, from the chips up.

Figure AI signed a deal with BMW to deploy robots at its Spartanburg, South Carolina plant. Tesla, meanwhile, quietly retooled sections of its Fremont factory for Optimus production. Figure AI vs Optimus isn’t just two different strategies — it’s two fundamentally different philosophies about how humanoid robotics will scale.

Understanding why Figure AI vs Optimus diverges this sharply matters for investors, engineers, and anyone tracking automation. The timelines, risks, and capital requirements couldn’t be more different.

Why Figure AI vs Optimus Defines the Humanoid Scaling Debate

Humanoid robotics is at a genuine crossroads. Two models are emerging for getting robots from prototype to mass production, and watching Figure AI vs Optimus play out in parallel is genuinely fascinating.

On one side of Figure AI vs Optimus, Figure AI chose the OEM partnership model. It embeds its robots inside existing manufacturing infrastructure. BMW’s Spartanburg plant already produces roughly 1,500 vehicles a day, so Figure doesn’t need to build factories — it needs to prove its robots can work alongside humans in a proven, high-pressure environment.

On the other side of Figure AI vs Optimus, Tesla chose vertical integration. Its approach mirrors what it did with electric vehicles: build the factory, design the chips, write the software, control every step. Fremont has undergone significant retooling for Optimus Gen 3 assembly lines. This playbook is ambitious and expensive, and it either pays off massively or it doesn’t.

Two Models Behind Figure AI vs Optimus

Figure AI vs Optimus scaling timelines look very different as a result. Figure can deploy robots incrementally across BMW’s global network of 31 plants. Tesla must invest billions in dedicated capacity before shipping a single unit externally.

In Figure AI vs Optimus terms, Figure’s capital risk is shared with BMW, while Tesla’s sits entirely on its own balance sheet. The partnership model lets Figure test real-world performance without betting the company on factory construction; Tesla believes owning the entire stack creates long-term advantages that justify the cost.

This isn’t just a manufacturing debate — Figure AI vs Optimus is a bet on which path reaches meaningful production volume first. The answer isn’t obvious, not even close.

Figure AI vs Optimus: Capital and Production Capacity Compared

Numbers tell the real story in the Figure AI vs Optimus comparison. Here’s what each company needs to spend and what they realistically expect to produce.

On Figure’s side of the Figure AI vs Optimus ledger, Figure AI raised $675 million in its Series B at a $2.6 billion valuation. Microsoft, NVIDIA, and Jeff Bezos all participated, which says something about the confidence in the room. That capital funds R&D and initial deployments, not factory construction — BMW absorbs the facility costs directly.

On Tesla’s side of Figure AI vs Optimus, Tesla generated over $8.9 billion in free cash flow in 2023. But dedicating Fremont floor space to Optimus means giving up vehicle production capacity — every square foot used for robots is a square foot not building a Model S, X, or 3, an opportunity cost that doesn’t show up in a press release.

Factor Figure AI (BMW Partnership) Tesla (Fremont In-House)
Estimated initial capex $200–400M (R&D focused) $1–3B (factory retooling)
Production facility cost Borne by BMW Borne by Tesla
Target initial annual units 500–1,000 (2025–2026) 1,000–5,000 (2026–2027)
Long-term annual target 10,000+ across OEM partners 100,000+ (Elon Musk’s stated goal)
Time to first deployment Already started (2024) Late 2025 earliest
Supply chain control Shared with BMW Fully owned
Revenue model Robot-as-a-service + unit sales Unit sales + internal deployment

Figure’s estimated initial capex runs $200 to $400 million, R&D-focused, with BMW covering the facility. Its initial target is 500 to 1,000 units a year by 2025–2026. Longer term, Figure aims for 10,000-plus units across OEM partners, with supply chain control shared with BMW throughout.

Tesla’s estimated initial capex runs $1 to $3 billion for factory retooling, borne entirely by Tesla. Its initial target is 1,000 to 5,000 units a year by 2026–2027. Longer term, Tesla is chasing Musk’s stated goal of 100,000-plus units annually, with supply chain control fully owned in-house.

Revenue models diverge too, another axis of Figure AI vs Optimus worth tracking. Figure blends robot-as-a-service contracts with unit sales, letting BMW pay for uptime rather than hardware alone. Tesla leans on unit sales plus internal deployment, mirroring how it sells cars directly rather than through dealers. Neither model is proven yet at scale.

The capex profiles reveal something most Figure AI vs Optimus coverage glosses over. Figure’s burn rate stays manageable because BMW handles facilities. Tesla’s approach requires massive upfront spending before a single dollar of external revenue materializes.

Unit economics differ too. Figure refines robot design while BMW handles logistics, tooling, and worker training. Tesla has to build all of that internally, from scratch. Tesla’s stated goal of sub-$20,000 units requires manufacturing scale that doesn’t exist yet — current low-volume humanoids run $50,000 to $150,000 per unit, another reminder of how far apart Figure AI vs Optimus economics really are.

Figure AI vs Optimus: Supply Chain Risk, Outsourced vs Owned

This is where the strategies diverge most sharply, and it’s the part most people skip over. Looking at Figure AI vs Optimus through a supply chain lens changes how you think about both bets.

On Figure’s side of Figure AI vs Optimus, BMW runs one of the world’s most sophisticated automotive supply chains. Spartanburg alone sources components from hundreds of Tier 1 and Tier 2 suppliers. Figure benefits from BMW’s purchasing power, logistics networks, and quality control systems — systems that took decades to build.

This isn’t a new pattern in manufacturing. Automakers have outsourced specialized components like brakes, transmissions, and electronics to Tier 1 suppliers for decades. Figure is simply the newest category to slot into that existing relationship.

Figure gains access to BMW’s existing supplier relationships, ISO 9001-certified quality systems, logistics spanning three continents, a trained manufacturing workforce, and proven safety protocols for human-robot collaboration.

But the Figure side of Figure AI vs Optimus has real vulnerabilities too. Figure doesn’t fully control its own destiny. BMW could renegotiate terms, slow deployments, or prioritize vehicle production during a downturn. Figure must also design robots that fit BMW’s manufacturing constraints, not the other way around.

Where Figure AI vs Optimus Diverge on Risk

On Tesla’s side of Figure AI vs Optimus, Tesla controls everything. It designs its own chips through Dojo, makes battery packs in-house, and writes its own software stack. For Optimus, Tesla can optimize every component for cost and performance without negotiating with partners.

That control comes at a price. Tesla must build humanoid-specific supply chains essentially from scratch. Actuators for bipedal robots differ fundamentally from EV motors, and the sensors needed for humanoid manipulation don’t overlap much with autopilot hardware.

The Figure AI vs Optimus risk profile breaks down cleanly:

  • Partner dependency risk: high for Figure, near zero for Tesla
  • Capital intensity risk: low for Figure, very high for Tesla
  • Component sourcing risk: low for Figure (BMW’s network), high for Tesla (new suppliers)
  • Timeline risk: moderate for Figure, high for Tesla (factory delays compound fast)
  • Design flexibility risk: moderate for Figure (BMW constraints), low for Tesla (full control)

Each side of Figure AI vs Optimus trades one set of risks for another. Neither is clearly superior — the question is which risks prove more manageable in practice.

Why Automakers Are Betting on Figure AI vs Optimus Differently

The Figure AI vs Optimus comparison reveals a broader industry trend worth sitting with. Traditional automakers see humanoids as tools. Tesla sees them as products. That distinction explains almost everything else.

The clearest way to frame Figure AI vs Optimus philosophically: BMW doesn’t want to sell robots — it wants robots that make car manufacturing cheaper and more flexible. BMW has invested heavily in factory automation for decades, and humanoid robots are the logical next step, handling tasks fixed automation can’t: moving between workstations, adapting to model changeovers, working in spaces built for humans.

For BMW, Figure’s robots are a means to an end. They cut labor costs in physically demanding tasks like body shop work and internal logistics. BMW doesn’t care who builds the robot — it cares about uptime, reliability, and cost per task hour.

BMW isn’t the only data point in Figure AI vs Optimus. Other automakers are placing similar bets:

  • Mercedes-Benz partnered with Apptronik to test Apollo robots in its plants
  • Hyundai acquired Boston Dynamics and is integrating robots into its operations
  • Toyota Research Institute continues developing humanoid capabilities internally

None of these OEMs are trying to sell robots to consumers. They’re focused on internal deployment first, which creates a fundamentally different incentive structure than Tesla’s. That momentum matters for Figure specifically — every additional automaker signing a similar deal validates the partnership model and hands Figure more real-world data to refine its robots.

On Tesla’s end of Figure AI vs Optimus, Elon Musk has repeatedly said Optimus could become Tesla’s most valuable product. He envisions millions of units doing household tasks, elder care, and industrial work. Tesla isn’t building Optimus primarily to improve its own factories — it’s building Optimus to sell.

That’s a completely different business, and it’s why Tesla needs the Fremont restart. You can’t sell millions of robots through a partner’s factory. This is the sharpest contrast in Figure AI vs Optimus: Figure’s BMW deal gets humanoids into real production faster, while Tesla’s Fremont restart positions Optimus for a far larger addressable market.

Figure AI vs Optimus: Comparing Timelines to Scale

The Figure AI vs Optimus timeline comparison favors Figure in the short term and Tesla in the long term. But “long term” is doing a lot of work in that sentence, and robotics timelines have a long history of slipping.

Figure’s timeline:

  • 2024: Initial deployment of Figure 02 robots at BMW Spartanburg
  • 2025: Expanded deployment across multiple BMW workstations
  • 2026: Potential expansion to additional BMW plants globally
  • 2027–2028: New OEM partnerships, backed by a proven track record

Figure’s advantage in Figure AI vs Optimus is speed. Robots are already working in Spartanburg — that’s not vaporware. Each successful deployment builds the case for broader adoption, and real-world data from BMW helps Figure improve faster than simulation alone.

Tesla’s timeline:

  • 2024: Internal testing of Optimus Gen 2 at Fremont and Giga Texas
  • 2025: Fremont retooling for dedicated Optimus production lines
  • 2026: Limited Gen 3 production run, estimated in the hundreds of units
  • 2027–2028: Scaled production targeting thousands of units annually
  • 2030+: Mass production toward Musk’s stated goal of millions per year

On Tesla’s side of Figure AI vs Optimus, the timeline has already slipped, and it’s worth being honest about that. Musk originally suggested Optimus would be in production by 2025. The Gen 3 ramp has faced delays tied to actuator reliability and software integration. Still, Tesla’s deep pockets provide runway most startups don’t have.

Key risks for Figure:

  • BMW could slow deployments if conditions worsen
  • Proving ROI at Spartanburg is essential before expansion
  • Competition from Apptronik, Agility Robotics, and others for the same OEM deals

Key risks for Tesla:

  • Factory retooling delays compound quickly and expensively
  • Actuator and battery supply constraints remain unresolved
  • Software maturity for unstructured environments is still unsolved
  • Pulling engineering resources from vehicle production carries its own cost

These timelines aren’t fixed. A breakthrough in AI-driven manipulation could speed up either company. A recession could slow both. Figure AI vs Optimus, ultimately, is a bet on which risks show up first.

Conclusion: What Figure AI vs Optimus Means for Robotics

The debate over Figure AI vs Optimus isn’t really about which company builds a better robot. It’s about which manufacturing philosophy wins the race to scale, and those are genuinely different questions.

On one side of Figure AI vs Optimus, Figure chose the partnership path: faster, cheaper, and lower risk near term. BMW provides the factory, supply chain, and workforce; Figure provides the robot. This gets humanoids into real production today, not a demo reel.

On the other side, Tesla chose vertical integration: slower, more expensive, higher risk, but with essentially unlimited upside if it reaches mass production. Owning the entire stack means controlling cost, quality, and margin at scale in ways a partnership never can.

Watch these Figure AI vs Optimus signals over the next 18 months. Does BMW expand Figure’s deployment or quietly scale it back? Can Tesla actually produce hundreds of Optimus units by late 2026? Do other automakers sign deals with Figure? Does Tesla’s cost per unit approach $20,000? And where does investor capital actually flow?

Figure AI vs Optimus may not produce a single winner. Both models could succeed in different segments — Figure dominating industrial deployment through OEM partnerships, Tesla owning consumer and small-business markets through vertical integration. Whichever model wins, the manufacturing playbook that emerges will likely define how every other robotics company approaches scale for the next decade.

FAQ About Figure AI vs Optimus

Which Company Wins the Figure AI vs Optimus Race First?

In the Figure AI vs Optimus race, Figure AI will likely deploy robots in production environments first — it already has units operating at BMW’s Spartanburg plant. Tesla aims for much higher volume over the long run, though. Deployment isn’t the same as mass production: Figure deploys into existing factories, while Tesla plans to build its own capacity for potentially millions of units.

How Much Does a Humanoid Robot Cost in the Figure AI vs Optimus Comparison?

Current estimates put humanoid robots at $50,000 to $150,000 per unit at low volumes. Tesla has stated a target of under $20,000 per Optimus at scale, while Figure hasn’t shared per-unit costs — a real gap in the Figure AI vs Optimus numbers. Costs drop with volume, but that requires runs of tens of thousands of units a year.

Why Did BMW Partner With Figure AI Instead of Building Its Own Robot?

BMW is an automaker, not a robotics company, and that’s central to understanding Figure AI vs Optimus. Building humanoid robots requires deep expertise in bipedal movement, AI-driven manipulation, and real-time perception. Partnering with Figure lets BMW access cutting-edge robotics without pulling R&D resources from its core vehicle business.

What Is Tesla’s Fremont Restart in the Figure AI vs Optimus Story?

Tesla’s Fremont restart is the other half of Figure AI vs Optimus: retooling production space at its Fremont, California factory for Optimus assembly. Tesla is converting floor space previously used for vehicle production into dedicated Optimus manufacturing lines, including new tooling, testing equipment, and assembly stations built specifically for humanoid robot production.

Can Figure AI’s partnership model scale to millions of units?

Probably not through OEM partnerships alone. The partnership model works well for deploying thousands of robots across industrial settings. However, reaching millions of units would likely require Figure to either build its own factories or sign deals with dozens of manufacturing partners at once. Additionally, industrial demand may not support millions of units in the near term — the consumer market could, but Figure hasn’t announced any consumer plans yet. That’s a notable gap worth watching.

Can Figure AI’s Partnership Model Scale to Millions of Units?

Probably not through OEM partnerships alone — a real limit on Figure’s side of Figure AI vs Optimus. The model works well for deploying thousands of robots industrially, but reaching millions would likely require Figure to build its own factories or sign dozens of partnerships at once. The consumer market could support that volume, but Figure hasn’t announced consumer plans.

The Truth About Moonshot’s Rapid Kimi Releases

Kimi K3 vs K2.7

Moonshot AI just shipped its fifth major model in about twelve months. Kimi K3 landed on July 16, 2026 — a 2.8-trillion-parameter system the company calls the largest open-weight model ever built. Five weeks earlier, Kimi K2.7 Code arrived with its own set of bold claims.

Put those two releases side by side and a real question shows up. In the Kimi K3 vs K2.7 story, is Moonshot building toward genuine open-source dominance, or just outrunning its own ability to prove each release actually matters?

A model launch and a market movement occurring close together do not establish causation. The earlier Nasdaq and Nvidia percentage moves were not supported by a dated market-data source or evidence isolating the effect of K3, so they should not be used to explain the launch’s impact.

This piece walks through what actually changed between K2.7 and K3, how Moonshot’s speed compares to OpenAI, Anthropic, and DeepSeek, and whether shipping this fast is smart strategy or something closer to panic.

Kimi K3 vs K2.7: Why Moonshot’s Launch Reignited the Speed Debate

Moonshot AI was founded in March 2023 by Zhilin Yang, a Tsinghua University alumnus, and is backed by Alibaba. For most of its life, the company has built its reputation on one thing: shipping fast.

Kimi K3 pushed that reputation further than ever. At 2.8 trillion total parameters, it’s roughly 75% larger than DeepSeek’s V4 Pro, previously the biggest widely-used open model. It activates just 16 of 896 experts per token, ships with a 1-million-token context window, native visual understanding, and an always-on “thinking mode” that keeps reasoning switched on by default.

Two architectural innovations sit under the hood: Kimi Delta Attention, a hybrid linear attention mechanism that Moonshot says enables roughly 6.3x faster decoding, and Attention Residuals, a replacement for standard residual connections. Both were previously published as open research, which matters — this wasn’t just a bigger version of the same architecture. It’s a genuine engineering bet.

The timing wasn’t an accident either. K3 landed just ahead of the 2026 World Artificial Intelligence Conference in Shanghai, and multiple outlets framed it as a comeback moment for a company whose market position had reportedly slipped over the previous 18 months as DeepSeek surged. Moonshot published the full Kimi K3 weights on July 27, 2026. Availability was rechecked on September 16, 2026; the earlier pending-release description is obsolete.

Here’s what makes the Kimi K3 vs K2.7 story worth examining closely: K3 arrived just five weeks after Kimi K2.7 Code, itself the fifth major release in the K2 family within a year. That’s an unusually tight gap, even by Moonshot’s own fast-moving standards — and it’s exactly the kind of pace that made last quarter’s K2.7 launch feel more like a footnote than an event.

Kimi K3 vs K2.7: A Timeline of Five Releases in Twelve Months

Reading the K3 announcement in isolation makes Moonshot’s pace look almost inevitable. Reading the full timeline is more revealing.

  • July 2025 — Kimi K2 launches as an open-weight MoE model and immediately posts strong coding benchmark results.
  • September 2025 — Kimi-K2-Instruct-0905 improves coding performance and doubles the context window to 256K tokens.
  • Late 2025 / early 2026 — Kimi K2.5 ships quietly and gets picked up by other labs; Thinking Machines later uses it to generate early post-training data for its Inkling model.
  • April 2026 — Kimi K2.6 becomes the general-purpose flagship and, per Artificial Analysis, ranks as the strongest open-weight model on its intelligence index that month.
  • June 12, 2026 — Kimi K2.7 Code ships as a coding-specialized build on top of K2.6, claiming double-digit gains on Moonshot’s own benchmarks and roughly 30% lower reasoning-token usage.
  • July 16, 2026 — Kimi K3 arrives: 2.8 trillion parameters, native vision, 1-million-token context, and a genuine architectural overhaul.

Comparing release pace requires a common definition of a major release and a fixed observation window. A weights release, API launch, specialist variant and research preview should not be counted interchangeably.

Kimi K3 vs K2.7 vs the World: How Moonshot’s Cadence Compares to OpenAI, Anthropic, and DeepSee

Use the following checklist to compare release cadence on a consistent basis:

Comparison item Record Purpose Common mismatch Verification
Major release A stated definition and time window Count comparable events Mixing preview, variant and flagship Dated official releases
Availability API, weights and deployment access Know what can be used Announcement treated as full availability Repository and provider documentation
Evaluation Exact model and benchmark version Compare like with like Different prompts, tools or budgets Methods and results
Operating cost Token categories and pricing date Estimate the actual bill Mixing cached input and output Current provider terms
Production adoption Named scope and date Separate trial from sustained use Integration treated as company-wide rollout First-party deployment account

Without a consistently defined and sourced release inventory, this article does not establish that Moonshot’s rivals release at the stated slower rate.

That difference used to be the whole “hangover” argument: ship something impressive, then bury it under the next release before anyone finishes evaluating it. The Kimi K3 vs K2.7 comparison complicates that story, though, because K3 isn’t a minor refresh of K2.7 — it’s a different architecture, a different scale class, and a genuine leap rather than a patch.

Anthropic’s approach still offers the clearest contrast. Claude Fable 5, Anthropic’s current top-tier public model, sits behind a more selective rollout, and Anthropic has kept its most capable system, Claude Mythos 5, restricted to a small number of organizations under its Project Glasswing program rather than shipping it broadly. That’s the opposite instinct from Moonshot’s open-and-fast approach: restrict access first, prove reliability, expand later.

Moonshot’s own framing of K3 was notably measured. The company said that while overall performance still trails Claude Fable 5 and GPT-5.6 Sol, K3 “demonstrated frontier-level performance” across its evaluation suite and “consistently outperformed other tested models.” That’s a nuanced position — not the best model in the world, but competitive enough to matter, at a very different price point.

Kimi K3 vs K2.7: Are the Benchmark Gains Real or Just Bigger Numbers?

Every fast-shipping lab faces the same skepticism: are the benchmark improvements real, or just numbers picked to look good in a press release? The Kimi K3 vs K2.7 comparison gives two very different answers.

Treat publisher-reported benchmark gains as claims under the publisher’s stated conditions. The earlier K2.7 percentages were not supported here by an accessible primary evaluation record with enough detail to reproduce the comparison; they should not be treated as independently verified gains.

Independent evaluations can help when their model version, date and conditions are recorded. The earlier claim that trackers validated K3 within hours is not established by the evidence cited here.

  • Record the exact leaderboard, evaluation date and model identifier before comparing a ranking. The earlier #18-to-#1 launch-day statement is not independently established by the sources cited here.
  • Distinguish an analyst’s interpretation from a reproducible benchmark result; include a primary source before quoting an attributed assessment.

Accuracy, hallucination rate and refusal behavior are different measures. A composite score can change without every component improving; inspect the dated evaluation definition and underlying results before drawing a conclusion about K3.

The useful comparison is whether a model improves the tasks you actually run, at an acceptable cost and error rate. A release announcement and a larger parameter count do not establish that result.

Does Speed Convert to Loyalty? What Kimi K3 Means for Retention

Adoption and retention require their own evidence. A model release or public repository is not a measure of active users or sustained enterprise use.

The earlier 36-million monthly-active-user figure lacks a dated primary source in this article. Do not use it as a current adoption measure or assume that an integration proves production-wide use:

  • A coding-tool integration needs an official description of which model is used and for what purpose.
  • An enterprise experiment is different from a sustained production deployment; record the scope and date.
  • Using a model to generate training data is different from adopting it as a deployed application; the distinction needs a first-party account.

An announcement of an integration should be checked for its scope and date. It is not sufficient evidence of user retention, production reliability or company-wide adoption.

Public discussion can mix technical, commercial and political interpretations. Such commentary should not be treated as measured model performance or adoption.

Frequent releases can create integration work when interfaces or deployment requirements change. Whether a particular organization accepts that cost needs an actual deployment account, not an inferred customer list.

Conclusion: Should You Build on Kimi K3 vs K2.7 Right Now?

Here’s where this gets useful instead of just theoretical.

If you already operate a Kimi deployment, compare the released K3 against your own tasks before migrating. Check current API prices, token categories and model availability directly with the provider; the earlier undated $0.95/$4 versus $3/$15 comparison is not a current quote.

If you’re evaluating Kimi for the first time, the full K3 weights are now available. Review the official model card, licence and deployment requirements before committing to self-hosting; availability alone does not establish that a deployment meets your needs.

If you’re chasing frontier general capability, long context, or multimodal input: K3 is the one to watch. The 1-million-token context window and native vision put it in a different category from K2.7 Code, which was purpose-built for coding and agent workflows specifically.

For an outside evaluation, use dated model documentation, reproducible benchmarks and confirmed deployment accounts. Do not substitute a claimed launch-day ranking or named-customer list for those records.

Release speed is one input into a deployment decision. Sustained quality, operating cost, integration effort and a clear support path matter after launch.

FAQ: Kimi K3 vs K2.7 and Moonshot’s Release Pace

What is Kimi K3?

Kimi K3 is Moonshot AI’s flagship large language model, released July 16, 2026. It’s a 2.8-trillion-parameter Mixture-of-Experts model with a 1-million-token context window, native visual understanding, and always-on reasoning, built around two new architectural components: Kimi Delta Attention and Attention Residuals.

How is Kimi K3 different from Kimi K2.7 Code?

Kimi K2.7 Code, released June 12, 2026, is a coding-specialized model built on top of K2.6, aimed at long-horizon software engineering tasks. Kimi K3 is a much larger general-purpose flagship with a different architecture, native vision, and a far bigger context window. In the Kimi K3 vs K2.7 comparison, K2.7 is the specialist and K3 is the generalist.

Is Kimi K3 open source?

Kimi K3 is open-weight. Moonshot released the full weights on July 27, 2026. The official repository identifies the applicable Kimi K3 License; review its actual terms rather than relying on a pending-release description.

How much does Kimi K3 cost to use?

Check the provider’s current pricing page for the selected model and token category. This article does not establish the earlier quoted API rates as current or directly comparable with rival services.

Does Kimi K3 beat Claude and GPT models?

The official K3 release material establishes the released model and accompanying technical report. It does not by itself establish a current independent leaderboard position or a universal lower cost per task. Compare dated evaluations and your own workload.

Should developers switch to Kimi K3 right away?

Not urgently. K3’s full weights were released on July 27, 2026. Teams already using K2.7 Code should test the released K3 against their own workflows and verify current costs before migrating.

The Full Truth About Microsoft Meta Capex

Microsoft Meta AI capex

Wall Street loves a big number. Right now, one Microsoft Meta AI capex figure is dominating every analyst briefing and investor call this earnings season.

But most coverage is missing the metric that actually tells you something useful. Everyone fixates on headline capital expenditure. The real story lives two layers deeper — in cost-per-token inference and datacenter utilization rates.

These two metrics reveal whether massive AI spending is producing cheaper, faster intelligence, or just burning cash impressively. Before going further, let’s set the headline figure aside and look at what the Microsoft Meta AI capex numbers actually mean once you dig past the press release.

Key Takeaways on Microsoft Meta AI Capex
  • Headline Microsoft Meta AI capex figures — over $80 billion for Microsoft, $60–65 billion for Meta — don’t measure efficiency on their own.
  • Cost-per-token inference is the real unit economics behind Microsoft Meta AI capex spending.
  • Datacenter utilization above 70–85% can matter more than billions in extra capex.
  • AMD’s MI300X packs more memory per chip than Nvidia’s H100, changing the Microsoft Meta AI capex hardware math.
  • The pricing gap between frontier and open-source models runs as high as 167X — the real stress test of whether Microsoft Meta AI capex spending is working.

Why the Headline Microsoft Meta AI Capex Number Misleads Investors

Microsoft reportedly plans to spend over $80 billion on AI infrastructure in fiscal year 2025. Meta’s capex guidance sits in the $60 to $65 billion range. Both numbers grab headlines, but they don’t tell the whole story.

Raw capex tells you nothing about efficiency. A company could spend $100 billion and get genuinely poor returns. Another could spend $30 billion and dominate inference economics. Across multiple tech cycles, the biggest spender rarely wins on unit economics.

Bloomberg reports that hyperscaler capex has grown roughly 60% year-over-year. Inference costs, meanwhile, have dropped sharply over the same period. That disconnect is the real Microsoft Meta AI capex story.

Consider two hypothetical companies, each spending $5 billion on identical GPU clusters. Company A runs at 80% utilization serving a mix of enterprise and internal products. Company B runs at 45% utilization serving one internal application with lumpy demand. After a year, Company A processes roughly 78% more tokens per dollar of capex — without spending an extra cent.

The Three Factors Behind Real Microsoft Meta AI Capex Performance

The difference comes down to three factors. First, what hardware they buy: Nvidia H100s, AMD MI300X accelerators, or custom silicon. Second, how efficiently they use it, measured by datacenter utilization. Third, what output they generate, measured by cost per token of inference.

When you hear about a Microsoft Meta AI capex number, the real question is simple: what’s the cost per unit of useful AI output? That’s the metric separating smart spending from vanity spending.

Cost-Per-Token-Inference Is the Real Microsoft Meta AI Capex Metric

Cost-per-token inference measures how much it costs to generate a single token of AI output — the unit economics of intelligence. One token is roughly four characters of text, and billions move through these systems every day.

This matters because the entire AI business model depends on inference becoming cheap enough to embed everywhere. Training a model is a one-time cost. Inference happens billions of times a day, every day, forever. The company with the lowest inference cost wins, full stop.

This metric connects Microsoft Meta AI capex spending directly to revenue potential. Microsoft serves inference through Azure OpenAI Service, GitHub Copilot, and Bing. Meta serves inference through Instagram recommendations, WhatsApp AI, and Llama-based products. Both need inference costs below a specific threshold to make these products profitable at scale.

Here’s a concrete way to see that threshold. GitHub Copilot charges roughly $10 per user per month. If the inference cost to power each user’s suggestions exceeds $4 a month, the product’s margin collapses before Microsoft covers a dollar of sales or marketing. Shaving that cost from $4 to $2 doesn’t just improve margins — it decides whether the product works at mass-market pricing at all.

OpenAI API pricing page shows how fast inference pricing has fallen. GPT-4 Turbo costs a fraction of what GPT-4 cost at launch, and that compression reflects real hardware and software efficiency gains — exactly what Microsoft Meta AI capex spending is supposed to deliver.

So when analysts discuss the one Microsoft Meta AI capex number, they should really ask how much cost-per-token inference dropped this quarter. A 30% reduction in inference cost matters more than a $10 billion capex increase.

Neither company publishes exact internal cost-per-token figures, but you can estimate them: divide total inference-related capex by estimated token throughput. Track that ratio across four or five quarters, and the trend becomes readable even from public data.

Nvidia H100 vs AMD MI300X vs Custom Silicon in the Microsoft Meta AI Capex Race

Not all AI chips deliver equal value, and Microsoft Meta AI capex depends heavily on hardware choices.

Metric Nvidia H100 AMD MI300X Custom Silicon (Meta MTIA / Microsoft Maia)
Estimated unit cost $25,000–$40,000 $10,000–$15,000 $5,000–$10,000 (estimated)
HBM memory 80 GB HBM3 192 GB HBM3 Varies by design
Inference throughput High Competitive for large models Optimized for specific workloads
Power consumption (TDP) 700W 750W Typically lower
Software ecosystem CUDA (dominant) ROCm (improving) Proprietary
Availability Constrained More available Internal only
Best for General AI workloads Memory-heavy models High-volume, narrow tasks

Nvidia’s H100 costs an estimated $25,000 to $40,000 per unit, carries 80 GB of HBM3 memory, and runs on the dominant CUDA ecosystem, though availability stays constrained. AMD’s MI300X costs roughly $10,000 to $15,000, offers 192 GB of HBM3, and runs on the improving ROCm ecosystem with better availability. Custom silicon like Meta’s MTIA or Microsoft’s Maia is estimated at $5,000 to $10,000, with specs that vary by design and stay internal-only.

The MI300X’s memory advantage matters enormously for large language model inference, where model weights must fit inside GPU memory. AMD’s official MI300X page highlights that 192 GB HBM3 advantage directly.

Serving a 70-billion-parameter model in 16-bit precision takes roughly 140 GB of GPU memory. A single H100, at 80 GB, can’t hold that model alone — you need at least two chips working together, adding interconnect overhead. A single MI300X, at 192 GB, can hold the entire model on its own, simplifying the serving architecture and often reducing latency. At Meta and Microsoft’s scale, that simplification lowers cost per token directly.

Why Memory Determines Microsoft Meta AI Capex ROI

Microsoft’s approach is diversified. It buys Nvidia GPUs in massive quantities while developing Maia 100, its own custom accelerator. This hedges supply risk and can lower blended cost per token — a structural advantage that doesn’t show up in headline Microsoft Meta AI capex figures.

Meta leans harder into custom silicon. Its MTIA chip targets the recommendation and ranking workloads behind its core ad business. That specificity lets Meta optimize silicon for narrow tasks instead of buying general-purpose GPUs at a premium.

Both companies are also buying Nvidia’s B200 and GB200 chips, which promise 2 to 4X inference gains over the H100. Still, custom silicon remains the long-term cost play for anyone running at hyperscale.

The ROI picture breaks down simply. Nvidia H100 offers the fastest deployment and broadest flexibility at the highest cost. AMD MI300X offers better memory economics and lower acquisition cost. Custom silicon offers the lowest long-term cost per token, at the highest upfront R&D investment and narrowest use case.

When evaluating Microsoft Meta AI capex, watch the hardware mix. A shift toward custom silicon signals confidence in sustained, high-volume inference demand — worth more than any single quarter’s spending figure.

Datacenter Utilization: The Multiplier Behind Microsoft Meta AI Capex

You can buy the best chips in the world, but running datacenters at low utilization burns money fast. This overlooked multiplier sits quietly behind every Microsoft Meta AI capex report.

Utilization rate measures the percentage of time GPU resources actively process workloads. Top-tier hyperscalers run at 70 to 85% utilization. Average cloud providers run 50 to 65%. Enterprise on-premises deployments often run just 20 to 40%.

Utilization directly impacts effective cost per token. A datacenter with 10,000 H100 GPUs at 80% utilization processes roughly 4X more tokens per dollar than the same facility at 20%. Fixed costs — power, cooling, real estate, staff — don’t change with utilization, so higher utilization sharply improves unit economics without another dollar spent.

One technique both companies use is batching inference requests. Instead of processing each query the moment it arrives, the system queues a small batch and processes them together, filling more of the chip’s parallel capacity per pass. The tradeoff is a few milliseconds of added latency for meaningfully better throughput per dollar.

Microsoft has a structural advantage here. Azure serves thousands of enterprise customers alongside Microsoft’s own products, and that diversity smooths utilization curves — when Copilot demand dips, API customers fill the gap.

Meta faces a different challenge. Its infrastructure mainly serves internal products, so utilization depends heavily on user engagement patterns. Meta’s advantage is workload predictability: it knows exactly what its models need and can right-size infrastructure precisely, including scheduling non-urgent jobs during off-peak hours.

Power availability is increasingly constraining utilization for everyone. Both companies are investing in nuclear, solar, and natural gas power sources to address it. The U.S. Department of Energy has formally acknowledged the growing overlap between AI infrastructure and energy policy.

The bottom line: a 10-percentage-point utilization improvement can matter more than billions in additional Microsoft Meta AI capex spending.

The 167X Pricing Gap Inside Microsoft Meta AI Capex Spending

Here’s a number that should stop you cold: frontier models like GPT-4o can cost 167 times more per token than efficient open-source alternatives running on optimized infrastructure. That gap is the ultimate stress test of whether Microsoft Meta AI capex spending is actually working.

Model tier Approximate cost per million tokens (output) Relative cost
Frontier proprietary (e.g., GPT-4) $15–$60 167X
Mid-tier proprietary (e.g., GPT-4o mini) $0.60–$2.00 7X
Open-source optimized (e.g., Llama 3.1 70B on custom silicon) $0.10–$0.35 1X

Frontier proprietary models like GPT-4 run $15 to $60 per million output tokens, about 167 times the cheapest tier. Mid-tier proprietary models like GPT-4o mini run $0.60 to $2.00, about 7 times the baseline. Open-source models like Llama 3.1 70B on custom silicon run $0.10 to $0.35 — the baseline itself.

Microsoft monetizes inference through premium Azure pricing. Meta gives Llama away free and monetizes through advertising instead. Both need inference costs to fall, but for structurally opposite reasons: Microsoft to protect margins while competing on price, Meta because inference is a cost center rather than revenue.

The direction of Microsoft Meta AI capex spending shows where each company expects to compete on this spectrum. Microsoft’s Nvidia purchases support frontier model serving at the top. Meta’s custom silicon investments target the bottom of the cost curve deliberately.

This gap is shrinking fast, and that compression is the real story behind Microsoft Meta AI capex headlines. Every quarter, inference gets cheaper. Faster compression means faster returns on capex. Slower compression means billions in spending sit idle longer than the market expects.

Watch third-party API pricing from providers like Together AI, Fireworks AI, and Groq, who compete aggressively on open-source inference cost. When their prices drop, hardware efficiency gains are flowing to the market. When Microsoft or OpenAI cut Azure AI pricing afterward, it confirms those same gains have reached frontier infrastructure.

A simple way to track this: compare capex growth to inference cost reduction. If capex grows 50% and inference costs drop 60%, that’s productive spending. If capex grows 50% and costs drop only 10%, something isn’t working, no matter how polished the earnings commentary sounds.

Conclusion: What Microsoft Meta AI Capex Numbers Really Tell You

The Microsoft Meta AI capex conversation shouldn’t focus on headline spending. It should focus on cost-per-token inference and datacenter utilization, because these metrics reveal whether trillion-dollar investments translate into cheaper, more accessible AI, or just impressive press releases.

Here’s what to actually do next. Watch for inference cost disclosures during earnings calls — any mention of cost-per-token trends signals real operational progress, not just spending ambition. Track the hardware mix, since shifts toward custom silicon like Maia or MTIA indicate long-term confidence in sustained inference demand.

Monitor utilization commentary too. Even vague references to “improved datacenter efficiency” hint at meaningful gains. Compare capex growth to pricing changes by cross-referencing Azure AI pricing updates with capex announcements. And follow the 167X pricing gap — as it closes, it confirms Microsoft Meta AI capex spending is genuinely working.

Next time you see coverage of Microsoft Meta AI capex, look past the billions. Look at the tokens. That’s where the real story has always been.

FAQ About Microsoft Meta AI Capex

What Is Cost-Per-Token-Inference and Why Does It Matter for Microsoft Meta AI Capex?

Cost-per-token inference measures how much it costs to generate one token of AI output, roughly four characters of text. It matters because Microsoft and Meta both serve billions of inference requests daily, so fractions of a cent compound into enormous differences. Lower cost per token means higher margins for Azure AI. For Meta, it means cheaper AI recommendations across Instagram, Facebook, and WhatsApp, where inference is a cost center, not revenue.

How Does the One Microsoft Meta AI Capex Number Differ From Total Capex?

Total capex includes offices, non-AI infrastructure, and general IT. The one Microsoft Meta AI capex number that matters is AI-specific spending: GPUs, custom accelerators, AI-optimized datacenters, and related power infrastructure. Analyst estimates suggest 60 to 80% of current hyperscaler capex targets AI workloads specifically. That AI-specific figure, paired with utilization data, is what actually reveals spending efficiency.

Which Chip Offers the Best ROI in the Microsoft Meta AI Capex Race?

It depends on the workload. Nvidia’s H100 offers the broadest software compatibility through CUDA, a real ecosystem advantage. AMD’s MI300X provides more memory at lower cost, making it attractive for large-model inference where memory constraints matter. Custom silicon like MTIA or Maia delivers the lowest long-term cost per token for specific, high-volume workloads, but requires years of R&D and only pays off at massive scale.

What Datacenter Utilization Rate Should Investors Watch in Microsoft Meta AI Capex Reports?

Industry benchmarks suggest 70 to 85% utilization is strong for hyperscale datacenters. Below 50%, fixed costs dominate and effective cost per token rises sharply. Utilization consistently above 90% can also signal insufficient headroom for demand spikes. Microsoft’s diversified Azure customer base helps maintain higher average utilization, while Meta achieves efficiency through workload predictability instead.

How Does the 167X Pricing Gap Affect Microsoft Meta AI Capex Decisions?

The 167X gap creates real strategic tension. Companies investing in frontier models need premium pricing to justify that capex. Companies optimizing for open-source inference need rock-bottom costs to make the economics work. As the gap narrows, pressure on frontier model providers intensifies. Both Microsoft and Meta hedge this risk by investing across the spectrum, from Nvidia’s latest GPUs to proprietary accelerators.

When Will Microsoft and Meta’s AI Capex Spending Become Profitable?
There’s no single date, since profitability depends on how fast inference costs keep falling relative to revenue growth. Microsoft’s Azure AI services already show margin improvement as cost-per-token drops, suggesting parts of its Microsoft Meta AI capex investment are paying off now. Meta’s payoff looks different, since it monetizes through engagement and ad revenue rather than direct API pricing. Watch the ratio of capex growth to inference cost reduction each quarter — that trend, more than any single earnings call, will show when the spending truly turns profitable.

The Surprising Reason Yale Made a Bold Bet on GPT-4

Yale AI governance framework

Yale built an AI governance framework around a single model’s risk profile, and that choice says more about where enterprise AI is heading than any benchmark leaderboard ever could. This wasn’t about which model scored highest on MMLU or HumanEval. It was almost stubbornly about risk.

Most organizations still chase capability metrics. Yale chased controllability instead, and that one decision is quietly reshaping how major institutions think about AI adoption.

So which model anchored the whole thing? OpenAI’s GPT-4 — not because it beat the competition on academic tests, but because its risk profile was the most thoroughly documented and governable model available at the time Yale made its decision. That distinction is worth sitting with, because it’s the whole argument in miniature: Yale’s AI governance framework wasn’t built to find the smartest model. It was built to find the one the university could actually explain to a regulator, a faculty senate, and a worried parent, all at once.

Why Yale Built Its AI Governance Framework Around One Model

Yale’s Information Technology Services department walked into 2023 facing a problem every large institution knows well. Faculty wanted generative AI tools. Researchers wanted them. Administrators wanted them too. Nobody had a playbook for deploying them safely inside a research university.

The stakes weren’t abstract. Yale handles protected health information, student records under FERPA, federally funded research data, and sensitive intellectual property. A single data leak could trigger regulatory action, loss of federal funding, or both at once. Picture a graduate researcher who pastes de-identified clinical trial notes into a public-facing AI tool: even without names attached, the combination of diagnosis codes, treatment timelines, and institutional identifiers could count as a HIPAA-reportable event. That kind of exposure doesn’t need malicious intent. It just needs a user who didn’t know where the line was.

That’s why Yale’s AI governance framework didn’t start with a capability comparison. It started with a risk taxonomy, mapping every AI use case against four categories: data sensitivity, output criticality, regulatory exposure, and vendor accountability — in plain terms, what information touches the model, whether a human reviews the output, which compliance rules apply, and whether the institution can audit the provider if something breaks.

Framework First, Model Second

GPT-4 won not on raw power but on auditability, contractual flexibility, and documented safety testing. This mirrors a broader trend that’s been building for a couple of years: governance-driven procurement is replacing benchmark-driven procurement at scale. Organizations aren’t asking “which model is smartest?” anymore. They’re asking “which model won’t get us sued?” and “which model can we actually explain to a regulator?” Yale’s AI governance framework answers both questions at once, which is exactly why other institutions are studying it as a template.

How Yale’s AI Governance Framework Replaces Benchmark Shopping

For years, the AI industry ran on what amounts to benchmark shopping. Teams compared models on standardized tests, picked the highest scorer, and shipped it. It’s a clean process, and a dangerously incomplete one.

Benchmarks measure capability. They don’t measure liability. They don’t capture how a model behaves when fed sensitive data, generates something harmful, or confidently hallucinates in a high-stakes context. That gap between benchmark performance and real-world risk behavior is consistently what bites organizations. A legal team that deploys a top-scoring model to help with contract review may not discover until a dispute arises that the model was fabricating case citations with total confidence — a failure mode no leaderboard score would ever have flagged.

Yale’s AI governance framework rests on one core insight: benchmarks are necessary but nowhere near sufficient.

Criteria Benchmark Shopping Risk Profiling (Yale’s Approach)
Primary metric Accuracy scores Risk exposure level
Data handling Rarely evaluated Central to decision
Compliance alignment Afterthought Prerequisite
Vendor transparency Optional Mandatory
Human oversight requirements Undefined Tiered by use case
Procurement timeline Weeks Months
Ongoing monitoring Ad hoc Systematic

Benchmark shopping treats accuracy scores as the primary metric, rarely evaluates data handling, treats compliance as an afterthought, makes vendor transparency optional, leaves human oversight undefined, moves through procurement in weeks, and checks model behavior only ad hoc. Yale’s AI governance framework flips every one of those defaults: risk exposure is the primary metric, data handling sits at the center of the decision, compliance is a prerequisite, vendor transparency is mandatory, human oversight is tiered by use case, procurement takes months, and monitoring runs systematically.

The difference is structural, not cosmetic. Yale’s model also creates a repeatable process, which might be the real advantage. When a new model hits the market, it doesn’t automatically replace the incumbent — it enters the same risk evaluation pipeline, full stop.

Model capabilities converge more than vendors want to admit. GPT-4, Claude 3.5, and Gemini Ultra perform similarly on most academic benchmarks. Their risk profiles, though, diverge sharply on data retention policies, training data transparency, and contractual liability terms. That divergence is where the real decision lives. One vendor might retain user inputs for model improvement by default, burying the opt-out in enterprise settings. Another might offer a zero-retention guarantee as a standard contract term. That difference never shows up on a benchmark leaderboard, and it’s the one that matters most to a compliance officer.

Stanford’s Human-Centered AI Institute has documented a similar pattern: institutions are increasingly weighting governance factors over raw performance. Yale’s AI governance framework simply got there early.

Inside Yale’s AI Governance Framework: The Four Risk Tiers

Let’s get specific, since abstraction only carries an argument so far. Yale’s AI governance framework runs across four concrete tiers, and understanding them is what makes the model replicable elsewhere.

  1. Tier one covers low-risk use cases: brainstorming, drafting non-sensitive communications, summarizing publicly available research. Faculty and staff can access approved tools with minimal oversight, as long as no protected data ever enters the model — that’s the hard line. A professor drafting a conference abstract or a staff member writing talking points for a public event both sit comfortably here.
  2. Tier two covers moderate-risk use cases: internal documents, non-classified research data, student-facing content. Human review is mandatory before any output reaches its audience, and data must be anonymized before submission. A department administrator drafting a summary of internal survey results, for example, would strip out respondent details first, then review the output before circulating it.
  3. Tier three covers high-risk use cases — FERPA-protected records, protected health information, federally funded research data. These require formal approval, dedicated infrastructure, and contractual guarantees from the vendor, not just suggestions. A researcher analyzing grant-funded clinical data would need written authorization, a signed data processing agreement, and a documented review protocol before any AI tool touches that dataset.

Tier four is simply prohibited: automated grading without human review, autonomous decisions on admissions, anything touching classified research. Organizations skip defining this tier explicitly more often than you’d think, and without a written prohibition, individual departments tend to fill the gap with optimism rather than caution.

Vendor Requirements Built Into Yale’s AI Governance Framework

Beyond the four tiers, Yale’s AI governance framework includes operational requirements that don’t get enough attention. Vendor data processing agreements must state that user inputs aren’t used for model training. Incident response protocols define exactly what happens when a model produces harmful or inaccurate outputs. Regular audits check whether actual usage matches approved use cases, not just whether policies exist on paper. Training requirements make sure users understand the boundaries before they touch the tools, and sunset clauses trigger automatic re-evaluation whenever vendor terms change.

This tiered structure is exactly why Yale’s AI governance framework centers on one model rather than an open marketplace. Managing risk across multiple vendors, each with different data policies and safety profiles, multiplies complexity fast. One additional vendor doesn’t just double the governance workload — it adds cross-vendor comparisons, inconsistent audit trails, and the real risk that users route sensitive tasks through whichever tool has the least friction. Still, the framework isn’t permanently locked to GPT-4. Anthropic’s Claude and Google’s Gemini are reportedly moving through the same risk evaluation pipeline right now. The model may change. The methodology won’t.

The Regulatory Pressure Behind Yale’s AI Governance Framework

Yale didn’t build this in a vacuum. Regulatory pressure is growing, and institutions without governance structures are building up legal exposure faster than most of them realize.

California’s AB 489, introduced in early 2024, proposes transparency requirements for AI systems used in education. It hasn’t passed yet, but its existence signals clear legislative intent, and it won’t be the last proposal of its kind. The National Institute of Standards and Technology released its AI Risk Management Framework specifically to help organizations build governance structures like Yale’s, which tells you something about where federal thinking is headed.

The Department of Justice has also set up an AI task force focused on algorithmic discrimination and fraud. That task force has signaled that “we deployed the best-performing model” won’t hold up as a legal defense if the model causes harm — a fact that should make any general counsel uncomfortable. If an AI tool used in a hiring-adjacent process produces outputs that disparately impact a protected class, the institution’s defense can’t simply be “the model scored 92 on the MMLU.” Regulators want process documentation, not performance certificates.

Yale’s AI governance framework maps cleanly onto this reality. Risk profiling creates documentation:

  • If regulators come knocking, Yale can show a systematic, defensible decision-making process rather than a gut call.
  • Tiered access limits liability, since not every user reaches every capability, shrinking the attack surface for compliance violations.
  • Vendor agreements shift responsibility, so the AI provider shares accountability for data handling failures instead of leaving Yale to absorb it alone.
  • Audit trails prove diligence, showing the institution didn’t just write policies — it enforced them.

Yale’s AI governance framework exists precisely because the regulatory environment demands it. Benchmark scores don’t hold up in court. Governance documentation does. The European Union’s AI Act is pushing American institutions toward similar frameworks ahead of time, too, and because Yale works with international researchers and partners, EU compliance isn’t optional.

How to Build Your Own Yale-Style AI Governance Framework

You don’t need Yale’s budget to do this. The principles scale down well, though you do need genuine institutional commitment to put risk ahead of capability — that part can’t be faked.

Six Steps to Replicate Yale’s AI Governance Framework

Step one: map your data. Before evaluating a single AI model, catalog every type of data your organization handles and classify each by sensitivity. Skip this step and everything downstream gets shaky. A community college might discover during this exercise that its admissions office handles more sensitive data than IT ever formally tracked — Social Security numbers in legacy forms, mental health disclosures in financial aid applications, immigration status buried in enrollment records.

Step two: define your risk tiers. Adopt something close to Yale’s four-tier structure, then customize the boundaries for your regulatory environment. A healthcare organization’s tiers will look different from a financial services firm’s, and that’s fine. What matters is writing the definitions down explicitly, getting legal sign-off, and communicating them before deployment starts, not after the first incident.

Step three: evaluate vendors on governance first. Build a scoring rubric that weights data handling, contractual terms, and transparency above benchmark performance. Ask whether the vendor retains user inputs for training, whether you can audit the model independently, what happens to your data if the vendor gets acquired, whether it carries cyber liability insurance, and how it handles government data requests.

Step four: start with one model. This is the most counterintuitive step and the most important one. Organizations want options, understandably, but Yale’s AI governance framework centers on a single model precisely because single-vendor governance is dramatically simpler to set up, monitor, and enforce. Optionality is a liability until your framework matures. You may occasionally hit a task where a different model performs better — accept that cost. The governance simplicity you gain is worth more than marginal capability gains across a fragmented vendor landscape.

Step five: build sunset and review triggers. Your chosen model won’t stay optimal forever, so build automatic review periods — quarterly or biannually — directly into the framework, and trigger reviews whenever a vendor changes its terms, not just on a calendar schedule.

Step six: train your users. Governance frameworks fail without user education, full stop. Yale requires training before granting access, and your organization should too, with specifics about what’s prohibited, not just what’s encouraged. A thirty-minute onboarding module walking users through real tier violations changes behavior more than a ten-page policy document nobody reads past the first paragraph.

MIT’s AI Risk Repository offers a solid, free catalog of AI risks that maps directly onto tier-definition work, and it’s a good starting point for building your own Yale-style AI governance framework from scratch.

Conclusion: What Yale’s AI Governance Framework Means for You

Yale built an AI governance framework around one model’s risk profile, and that decision is a genuine blueprint for any organization wrestling with AI adoption right now. The insight isn’t really about GPT-4 specifically. It’s about the methodology: risk profiling before capability scoring, governance before deployment, documentation before experimentation.

A few next steps worth taking:

  1. Audit your current AI usage and identify every tool and model in active use across your organization, including the unofficial ones.
  2. Classify your data and map sensitivity levels before evaluating any new AI vendor.
  3. Build a risk tier system using Yale’s four-tier model as your starting template.
  4. Evaluate vendors on governance, weighting data handling and contractual terms above benchmark scores.
  5. Start with one model to simplify your governance burden
  6. Review the NIST AI Risk Management Framework as your compliance baseline before anything else.

Benchmark shopping isn’t over, but it’s no longer sufficient on its own, and it was never a substitute for governance. Yale’s AI governance framework exists because responsible AI adoption actually requires this kind of structure. The question isn’t whether your organization will need something similar. It’s whether you build it proactively, or reactively, after something goes wrong.

FAQ About Yale’s AI Governance Framework

Why Did Yale’s AI Governance Framework Choose GPT-4 Over Claude or Gemini?

Yale selected GPT-4 mainly because its risk profile was the most thoroughly documented at the time of evaluation. OpenAI’s safety testing documentation, contractual flexibility on data handling, and willingness to negotiate enterprise terms all matched Yale’s governance requirements. This wasn’t a permanent choice — Yale’s AI governance framework is explicitly designed to allow model transitions as competitors mature their own governance offerings.

Does Yale’s AI Governance Framework Mean Benchmarks Don’t Matter?

Not at all. Benchmarks still matter for establishing baseline capability, but Yale’s AI governance framework treats them as necessary and not sufficient — a model has to clear a capability threshold to be worth considering. Once multiple models clear that bar, risk profiling becomes the deciding factor. Benchmarks are the qualifying round; governance is the final selection.

Can Smaller Organizations Replicate Yale’s AI Governance Framework?

Yes. The core principles behind Yale’s AI governance framework — data classification, risk tiering, vendor evaluation, and user training — scale to any organization size. You don’t need a dedicated governance team to start, but you do need executive commitment and a willingness to put risk management ahead of speed. Even a two-person startup handling customer data should classify that data first.

How Does Yale’s AI Governance Framework Handle New Models Entering the Market?

Yale’s AI governance framework includes built-in review triggers rather than relying on anyone remembering to check. When a new model launches or a vendor changes its terms, Yale’s governance team evaluates the change against established risk criteria, and quarterly reviews keep the framework current regardless of external events.

What Role Does FERPA Play in Yale’s AI Governance Framework?

FERPA, the Family Educational Rights and Privacy Act, is one of the hardest constraints in Yale’s AI governance framework. It governs how educational institutions handle student records, and it has real teeth. Any AI tool that might process student data has to meet FERPA’s strict requirements around access, storage, and sharing, which is why Yale’s tier system restricts student data to high-risk tiers with mandatory human oversight.

How Does Yale’s AI Governance Framework Relate to California’s AB 489?

Yale’s AI governance framework anticipates emerging legislation like AB 489 by building compliance-ready documentation before any legal mandate forces the issue. AB 489 hasn’t passed yet, but Yale’s tiered structure already meets or exceeds most proposed requirements around transparency, human oversight, and data handling. That’s precisely why Yale built its AI governance framework around one model instead of improvising.

AMD’s New 2nm Venice EPYC Could Be Nvidia’s Biggest Challenge

AMD's New 2nm Venice EPYC Could Be Nvidia's Biggest Challenge

AMD Venice EPYC just beat Nvidia to the most advanced chip-making process on the planet, and the reaction online has been a strange mix of genuine excitement and “wait, why does this matter again?” The next-generation EPYC server processor, codenamed Venice, is set to ship on TSMC’s 2nm node — a first for any major data center chip. Nvidia’s Rubin GPU architecture, by contrast, isn’t expected on 2nm until sometime in 2026.

So does a 2nm CPU actually dent Nvidia’s GPU business? It depends entirely on what you’re running. AMD Venice EPYC isn’t going to replace an H200 cluster for training a 70-billion-parameter model. But for a surprising share of enterprise workloads, AMD Venice EPYC hitting 2nm before Nvidia changes the math on cost and power. Here’s where the line between “CPU territory” and “GPU territory” actually sits today.

Why AMD Venice EPYC Hitting 2nm Actually Matters

Process node leadership sounds like bragging rights until you translate it into power efficiency and transistor density. TSMC’s N2 node is expected to deliver 10 to 15% faster performance at the same power draw, or roughly 25 to 30% lower power at the same speed. Multiply either number across a few thousand server racks and it stops being a rounding error.

Here’s the concrete version: a hyperscaler running 10,000 EPYC servers could retire 2,500 to 3,000 of them and keep the same total throughput — or keep every server running and cut the power bill by close to a quarter. At current power and cooling costs, that math gets attention fast.

AMD Venice EPYC is expected to pack up to 256 Zen 6 cores per socket, double the current Turin generation. The chip also brings CXL 3.0 memory expansion and DDR6 support, both of which open up memory bandwidth well beyond what’s available today. AMD’s EPYC line has climbed steadily since Naples, but this generation looks like the biggest jump yet.

What AMD Venice EPYC Means for Memory-Heavy Workloads

That core count and memory bandwidth combination matters most for a specific category of software: real-time databases, search indexing, and analytics pipelines. Picture a financial services firm running fraud-scoring models across millions of transactions a day — that workload depends on memory bandwidth and core count, not GPU-style parallel math. It’s exactly the kind of job AMD Venice EPYC was built for.

Nvidia’s current H200 runs on TSMC’s 4nm process, and the Blackwell B200 sits on a custom 4NP node. Nvidia’s first 2nm chips, under the Rubin name, aren’t due until late 2026. That gives AMD roughly a 12 to 18 month process advantage, which is close to forever in data center procurement terms. Budgets get approved and architecture decisions get locked in on timelines exactly this long.

AMD Venice EPYC vs Nvidia H200: A Real Cost Comparison

Total cost of ownership tells the real story here. Not every workload justifies an eight-GPU node priced north of $250,000 — though plenty of workloads do. Whether AMD Venice EPYC hitting 2nm matters for your infrastructure comes down to your specific workload mix, and it’s easy to get this wrong in either direction.

Workload Type Venice EPYC (2-Socket) Nvidia H200 (8-GPU Node) TCO Winner Performance Edge
PostgreSQL / MySQL databases ~$18,000 ~$250,000 EPYC by 13x EPYC: 3x throughput/dollar
Elasticsearch / search indexing ~$18,000 ~$250,000 EPYC by 13x EPYC: 5x efficiency
LLM fine-tuning (70B+ params) ~$18,000 ~$250,000 H200 by 40x H200: 40x faster training
LLM inference (batch) ~$18,000 ~$250,000 Depends on scale H200: 8x at high batch
LLM inference (single query) ~$18,000 ~$250,000 EPYC competitive EPYC: 70% of H200 speed
Video transcoding ~$18,000 ~$250,000 EPYC by 10x EPYC: comparable speed
Web serving / microservices ~$18,000 ~$250,000 EPYC by 13x EPYC: better latency
Computer vision training ~$18,000 ~$250,000 H200 by 25x H200: 25x faster epochs

A dual-socket AMD Venice EPYC server is projected to cost around $18,000, against roughly $250,000 for a fully loaded eight-GPU H200 node. For workloads that don’t need GPU-style parallelism, that gap is close to 13x. PostgreSQL and MySQL databases run about 3x the throughput per dollar on AMD Venice EPYC. Elasticsearch and search indexing see roughly 5x the efficiency. Video transcoding lands at around 10x the cost advantage with comparable speed, and web serving or microservices workloads come in at roughly 13x cheaper with noticeably better latency.

Put another way: the same $250,000 that buys one H200 node buys about thirteen dual-socket AMD Venice EPYC servers. A mid-sized e-commerce company running Elasticsearch for product search has no real reason to put that workload on GPU nodes — thirteen AMD Venice EPYC boxes handling search at five times the efficiency is a different infrastructure philosophy entirely.

Where AMD Venice EPYC Still Loses to Nvidia’s H200

None of that changes the training math. Fine-tuning a model with 70 billion or more parameters still favors the H200 by something like 40x, and computer vision training runs roughly 25x faster on GPUs. A 70-billion-parameter model that trains in three days across 256 H200 GPUs would take months on CPU cores alone. Anyone telling you AMD Venice EPYC changes that equation is selling you something.

Inference is genuinely more contested. According to Andreessen Horowitz’s compute spending analysis, inference already makes up more than 60% of total AI compute spend, and that share keeps climbing as models move from research into production. At low batch sizes, AMD Venice EPYC’s 256 cores handle a meaningful chunk of that workload efficiently. At high batch sizes, the H200 still wins by roughly 8x.

A rough rule holds up in practice: if a job runs for more than a few hours at a stretch, use GPUs. If you’re serving a model to live users at low latency, benchmark AMD Venice EPYC before assuming you need a GPU.

Where AMD Venice EPYC Wins the Inference Battle

Inference is where the AMD Venice EPYC 2nm advantage matters most, and the reasons go deeper than most coverage lets on.

CPU inference has already improved a lot. Earlier EPYC generations handle INT8 and BF16 inference workloads reasonably well, and Venice adds AVX-512 extensions built specifically for AI inference. Combine that with 256 cores of parallelism and you get real throughput without GPU overhead. Benchmark your own model before assuming anything, though the trend clearly favors CPUs for these jobs.

Five Places AMD Venice EPYC Has the Edge
  1. Low-latency, single-query inference is the clearest case. A chatbot serving one user at a time doesn’t need GPU batch processing. A support bot handling sequential conversations is a textbook example: requests arrive one at a time, so a GPU sitting mostly idle between them is pure waste. AMD Venice EPYC handles that pattern with lower tail latency and real cost savings.
  2. Small models are another strong fit. Anything under seven billion parameters runs efficiently on a high-core-count chip, and DDR6 bandwidth removes the memory bottleneck that held back earlier CPU generations.
  3. Retrieval-augmented generation pipelines fit well too, since they combine database lookups with model inference in the same request. AMD Venice EPYC handles both stages natively, while GPU setups need expensive data transfers between them. If your pipeline spends 60% of its time on retrieval anyway, putting everything on one CPU server removes a whole category of latency.
  4. Edge inference at scale is a fourth case worth naming. Retail locations, branch offices, and manufacturing floors often can’t support the power and cooling a GPU needs. A 700-watt card simply isn’t an option there, and AMD Venice EPYC’s efficiency at 2nm makes CPU-only edge deployment genuinely realistic.
  5. Quantized model serving rounds out the list. INT4 and INT8 quantization is now standard practice for production deployment, and the AVX-512 extensions in AMD Venice EPYC handle those formats well. A quantized Llama 3 8B model running on a 256-core AMD Venice EPYC box is a realistic production setup today, not a future promise.
Where GPUs Still Beat AMD Venice EPYC on Inference

Batch inference handling hundreds of simultaneous requests still favors GPUs, along with vision models processing high-resolution images and anything past 30 billion parameters. Any workload leaning on FP16 or FP8 matrix math at scale belongs on a GPU, full stop.

The MLPerf benchmark suite from MLCommons shows this split consistently. GPUs win throughput benchmarks by a wide margin, but CPUs hold their own on latency-sensitive, single-stream work. AMD Venice EPYC at 2nm should widen that CPU competitiveness further, before you even factor in the price difference.

Why Enterprises Are Diversifying Beyond Nvidia With AMD Venice EPYC

Nvidia’s dominance carries real supply chain risk. The company reportedly holds a backlog worth well over a trillion dollars for data center GPUs, with lead times running 6 to 12 months. That means enterprises often can’t get GPUs even when the budget is ready to spend.

Picture the common version of this: a team gets budget approval in Q1, places a GPU order, and watches delivery slip to Q4 while the product roadmap doesn’t move. Infrastructure teams everywhere have lived this scenario for two years, with little improvement.

That supply constraint is a big part of why AMD Venice EPYC hitting 2nm before Nvidia matters right now. Enterprises need alternatives, and building infrastructure around one vendor’s GPU supply is the kind of lock-in that should worry any procurement team.

Three Workload Tiers, and Where AMD Venice EPYC Fits

Smart infrastructure planning tends to split into three tiers. Tier one is GPU-essential: LLM training, vision model training, and large-scale batch inference, running on Nvidia H200/B200 or AMD’s own Instinct MI300X. Tier two is GPU-optional: medium-sized model inference, recommendation systems, and feature engineering, where AMD Venice EPYC handles the job cost-effectively. Tier three is CPU-optimal: databases, search, web serving, analytics, and small-model inference, where AMD Venice EPYC dominates outright.

Most enterprise workloads sit in tiers two and three. Gartner’s research puts more than 70% of enterprise compute spending toward traditional workloads that never touch a GPU, and infrastructure audits generally back that number up.

CXL 3.0 support lets a fleet of AMD Venice EPYC servers pool memory dynamically. A cluster could share 12TB of CXL-attached memory and allocate it based on active workloads, something GPU nodes don’t offer today. DDR6 roughly doubles the memory bandwidth of current DDR5 systems, which matters a lot for database and analytics work.

Practical Steps Before AMD Venice EPYC Ships

Power efficiency closes the argument. An H200 GPU draws 700 watts, and an eight-GPU node pulls past 10 kilowatts total. An AMD Venice EPYC server handling equivalent non-ML work might draw around 600 watts. In a power-constrained facility, that difference decides how many workloads actually fit — some colocation facilities are already turning away GPU-heavy customers because they can’t provision enough power per rack.

Three things are worth doing now, before AMD Venice EPYC actually ships. Move your top five CPU-optimal workloads off GPU instances today, freeing up capacity for jobs that actually need it. Benchmark ONNX Runtime and llama.cpp on your smallest production models to build a real baseline. Then negotiate GPU contracts with 90-day renewal windows instead of multi-year commitments, so you keep room to shift spend once AMD Venice EPYC ships.

How AMD Venice EPYC Stacks Up Against Intel and Nvidia

AMD isn’t only fighting Nvidia here. Intel’s Clearwater Forest Xeon processors are aimed at the same data center market, and while Intel has struggled with process delays, its disaggregated chiplet approach mirrors AMD’s own strategy. This is a three-way race, and the competition is pushing all three companies to move faster.

AMD still holds real advantages. Its chiplet design, refined across several EPYC generations, scales to high core counts better than Intel has managed — AMD Venice EPYC reportedly uses up to 16 compute chiplets on a single package, a density Intel hasn’t matched. That approach also gives AMD a yield advantage: a defect that would kill a monolithic die only damages one small chiplet, keeping manufacturing costs in check even at 2nm, where defect rates run higher.

AMD’s dual-track lineup helps its pitch too. The company sells both AMD Venice EPYC CPUs and Instinct MI300X GPUs, so it can offer a complete server solution — Venice for general workloads, MI300X for AI training, one vendor covering both chip types. That’s a genuinely appealing pitch to a procurement committee already frustrated with Nvidia’s lead times and pricing leverage.

AMD’s ROCm software stack has matured a lot too. PyTorch and TensorFlow now support AMD GPUs natively, lowering the switching cost away from Nvidia’s CUDA ecosystem. CUDA still leads on library depth, but the gap is closing faster than most people give it credit for.

The bigger market dynamics favor AMD as well. Hyperscalers like Microsoft, Google, and Meta are actively spreading their chip spending across multiple vendors, and they have the buying power to demand real alternatives. AMD Venice EPYC at 2nm gives them a strong reason to grow AMD’s share of their server fleets, right when the biggest buyers in the world are shopping for options.

Conclusion: Does AMD Venice EPYC Matter for Your Infrastructure?

So, does AMD Venice EPYC hitting 2nm before Nvidia matter for your infrastructure decisions? Yes — with a few caveats worth keeping in mind.

AMD Venice EPYC won’t replace H200 GPUs for training large AI models, and that was never really the point. Most enterprise workloads aren’t AI training at all — they’re databases, search engines, web applications, analytics pipelines, and a growing share of AI inference. For that category of work, a 256-core chip at 2nm delivers better performance per dollar and per watt than any GPU on the market, before factoring in GPU availability.

A few next steps worth taking now:

  1. Sort every application into GPU-essential, GPU-optional, and CPU-optimal buckets, regardless of AMD Venice EPYC’s timeline.
  2. Calculate real total cost of ownership, including power and cooling, since GPU nodes run 10 to 13x more than CPU servers for non-ML work.
  3. Start evaluation cycles now on current EPYC Turin hardware, and test CPU inference using ONNX Runtime or PyTorch’s CPU backend — the cost savings tend to surprise people.
  4. Diversify vendor strategy rather than betting everything on Nvidia GPU availability.

For most enterprise workloads, the answer is clear: AMD Venice EPYC hitting 2nm matters enormously, and the teams that act on it early will end up running leaner infrastructure than the ones still reaching for GPU instances.

FAQ: Your AMD Venice EPYC Questions Answered

Will AMD Venice EPYC Ship Before Nvidia’s 2nm GPUs?

Based on current roadmaps, yes. AMD Venice EPYC is expected in late 2025 or early 2026 on TSMC’s N2 node, while Nvidia’s Rubin architecture — its first 2nm GPU — isn’t expected until late 2026. That puts AMD roughly 12 to 18 months ahead in the data center. Roadmaps shift, but the gap looks wide enough to hold.

Can AMD Venice EPYC Replace GPUs for AI Inference?

It depends on model size and latency needs. Models under 7 billion parameters run well on AMD Venice EPYC’s high core count, and single-query, low-latency inference is another strong spot. Large batch inference and models past 30 billion parameters still favor GPUs by a wide margin, so benchmark your specific use case first.

How Many Cores Does AMD Venice EPYC Have?

AMD Venice EPYC is expected to offer up to 256 Zen 6 cores per socket, double the 128-core maximum on the current Turin generation. Each core also benefits from 2nm efficiency and clock speed gains. That “up to” is doing real work here, so wait for shipping silicon before locking in architecture decisions.

What Memory Technologies Does AMD Venice EPYC Support?

AMD Venice EPYC supports DDR6 memory, roughly doubling bandwidth versus current DDR5 systems, plus CXL 3.0 for disaggregated memory pooling. Together, those two features make AMD Venice EPYC well suited to memory-heavy work like databases and in-memory analytics — a combination GPU nodes can’t really replicate today.

Is AMD Venice EPYC a Real Threat to Nvidia?

For GPU-centric AI training, not really — Nvidia’s parallel processing advantage stays unchallenged there. But for the broader data center market, including databases, web serving, search, and CPU-based inference, AMD Venice EPYC’s 2nm lead creates real competitive pressure on infrastructure spending. That “broader market” happens to be most of the market.

How Does AMD Venice EPYC Compare to Intel’s Xeon Roadmap?

AMD Venice EPYC holds a significant process advantage over Intel’s Clearwater Forest Xeon chips, since Intel still relies on its own foundry processes, which trail TSMC’s leading nodes. AMD’s chiplet design also scales to higher core counts more efficiently. Intel is investing heavily to close that gap, but AMD Venice EPYC’s 2nm lead is substantial for now.