Enterprise AI Spending Hit $177B. Agents Are Driving the Bill

Enterprise AI Spending

Figures checked against Menlo Ventures’ 2026 State of Enterprise AI report on 4 November 2026. Market sizes are Menlo estimates, shown as annualised run rates.

The price of AI keeps falling. Menlo Ventures says the average open-source model token now costs about $0.13 per million, down 3.3x in a year, and closed models fell 24% to a blended $0.70. Yet enterprise AI spending, by Menlo’s estimate, rose 5.4x to $176.8 billion.

Cheaper inputs and much bigger bills sound contradictory. They aren’t. Menlo’s 2026 State of Enterprise AI report, published on 3 November, shows companies moving from paying for people to use AI towards paying for AI to do work. Work done by agents is measured in tokens, and agents use a lot of them.

Key Takeaways
  • Menlo estimates enterprise AI deployment spending at $176.8 billion by September 2026, separate from $102.5 billion in development spending.
  • Adoption rose 10 points; average spend per company rose 4.7x. Intensity, not new adopters, drove the growth.
  • On OpenRouter, agents now generate about 80% of tokens, a signal from a developer-heavy gateway, not an enterprise census.
  • Open-source models took 19% of tokens but 4% of spending, a gap almost entirely explained by Menlo’s average price difference.
  • Frontier labs hold 69% of deployment spending. Cost per finished task, not per token, may explain why buyers pay more.
  • Coding and assistants make up 76% of application spending, because coding gives agents clear, testable work.
  • Budgets need to become consumption budgets, with per-task tracking and limits.
  • Read the report with its methodology in mind: a US survey, a restated baseline and investment ties to Anthropic and OpenRouter.

Quick Navigation


Enterprise AI spending grew far faster than adoption

Menlo’s $176.8 billion is deployment spending: money companies spend using and running AI, split between $99.5 billion of infrastructure and $77.3 billion of applications. It’s separate from the $102.5 billion Menlo estimates for development, mostly training compute, which is money spent building models. The two shouldn’t be added together casually, and neither is the total global AI market.

Measure (Menlo estimates)Prior year2026Change
Enterprise AI deployment spending$33B$176.8B5.4x
AI development spendingNot stated here$102.5B5.3x
Enterprise AI adoption55%65%+10 points
Average spend per enterprise1x4.7x4.7x

The adoption line is the interesting one. Ten more percentage points of enterprises used AI, roughly 18% more adopters. Average spend per enterprise rose 4.7x. Almost all of the growth in enterprise AI spending came from companies that were already using AI and started using much more of it.

A rough check, as UniverseBlend analysis: 1.18 times more adopters, each spending 4.7 times as much on average, gives about 5.5x. That’s close to Menlo’s 5.4x market figure. The survey average and the market estimate are different measures, so this is a sanity check, not a decomposition. But it points the same way: intensity, not reach, is driving enterprise AI spending.

How agents change enterprise AI spending

A seat licence prices access. One employee, one monthly fee, whatever they do with it. An agent prices work. It takes a task, calls a model many times, reads files and tool outputs, and keeps going until it finishes or fails.

Menlo’s evidence for the shift comes from OpenRouter, a service that routes requests to many model providers through one API. According to the report, agent traffic overtook human traffic there in early February 2026. Since then, agent token traffic grew 37x while human-driven traffic grew 5x. Agents now account for about 80% of OpenRouter tokens, about 130.9 trillion a week. On those shares, agents generate roughly four times as many tokens as people do.

Those figures need context. OpenRouter is one gateway, and the report itself notes that its users skew towards individual developers and startups rather than enterprise buyers. Large companies often go directly to Anthropic, OpenAI, Google or their cloud provider, and OpenRouter’s own rankings page notes that it measures traffic routed through the service, not users or spend. The OpenRouter data shows the direction of travel, not a census of enterprise AI usage, and it comes from a different population than Menlo’s enterprise survey.

Enterprise AI spending is becoming a token-consumption problem
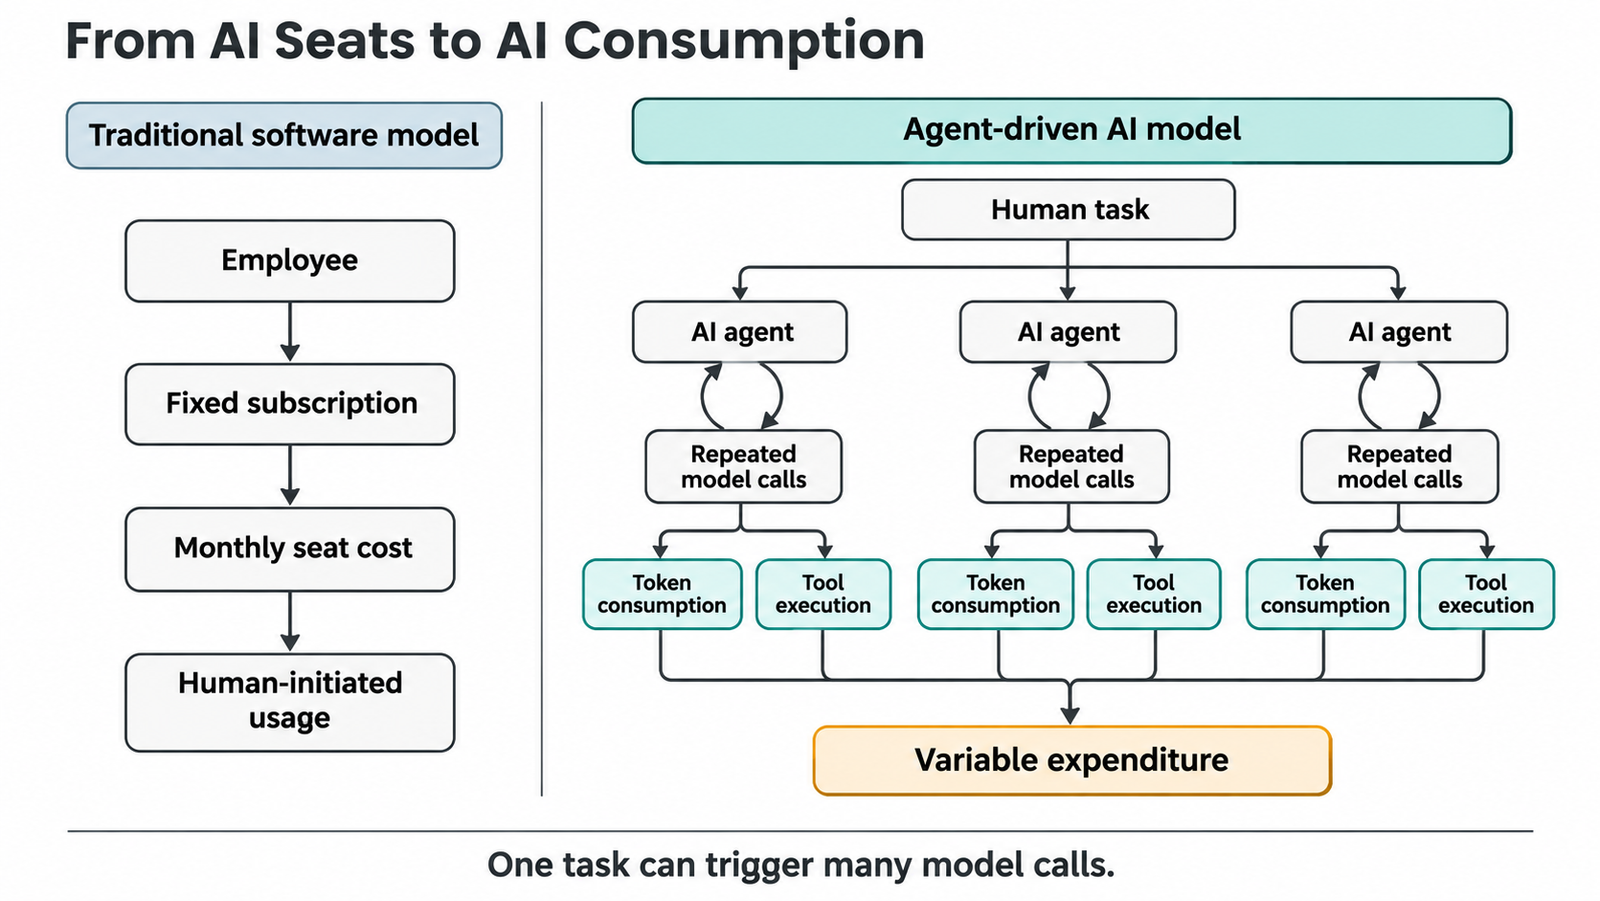
Seats predict access. They don't predict how much work agents will do.

Agents multiply tokens for mechanical reasons. Each step usually resends the conversation so far, so a 20-step task pays for its early context many times over. Tool results, such as search pages, file contents and test logs, land back in the context. Planning and self-checking add calls. Failed steps are retried. Parallel agents each carry their own copy of shared context.

Anthropic measured this on its own system in 2025. In its write-up of a multi-agent research system, it found that agents “typically use about 4× more tokens than chat interactions,” and multi-agent systems “about 15× more tokens than chats.” As UniverseBlend’s analysis of when adding an agent stops paying for itself put it, the unit of cost isn’t the agent but the model call, and “every call pays for its whole input again.”

That’s how prices and bills move in opposite directions. If a token costs a third as much but a task uses ten times as many tokens, the task costs more than three times as much. Enterprise AI spending stops tracking headcount and starts tracking how much work agents are given.

Open-source models take the volume. Frontier labs take the money
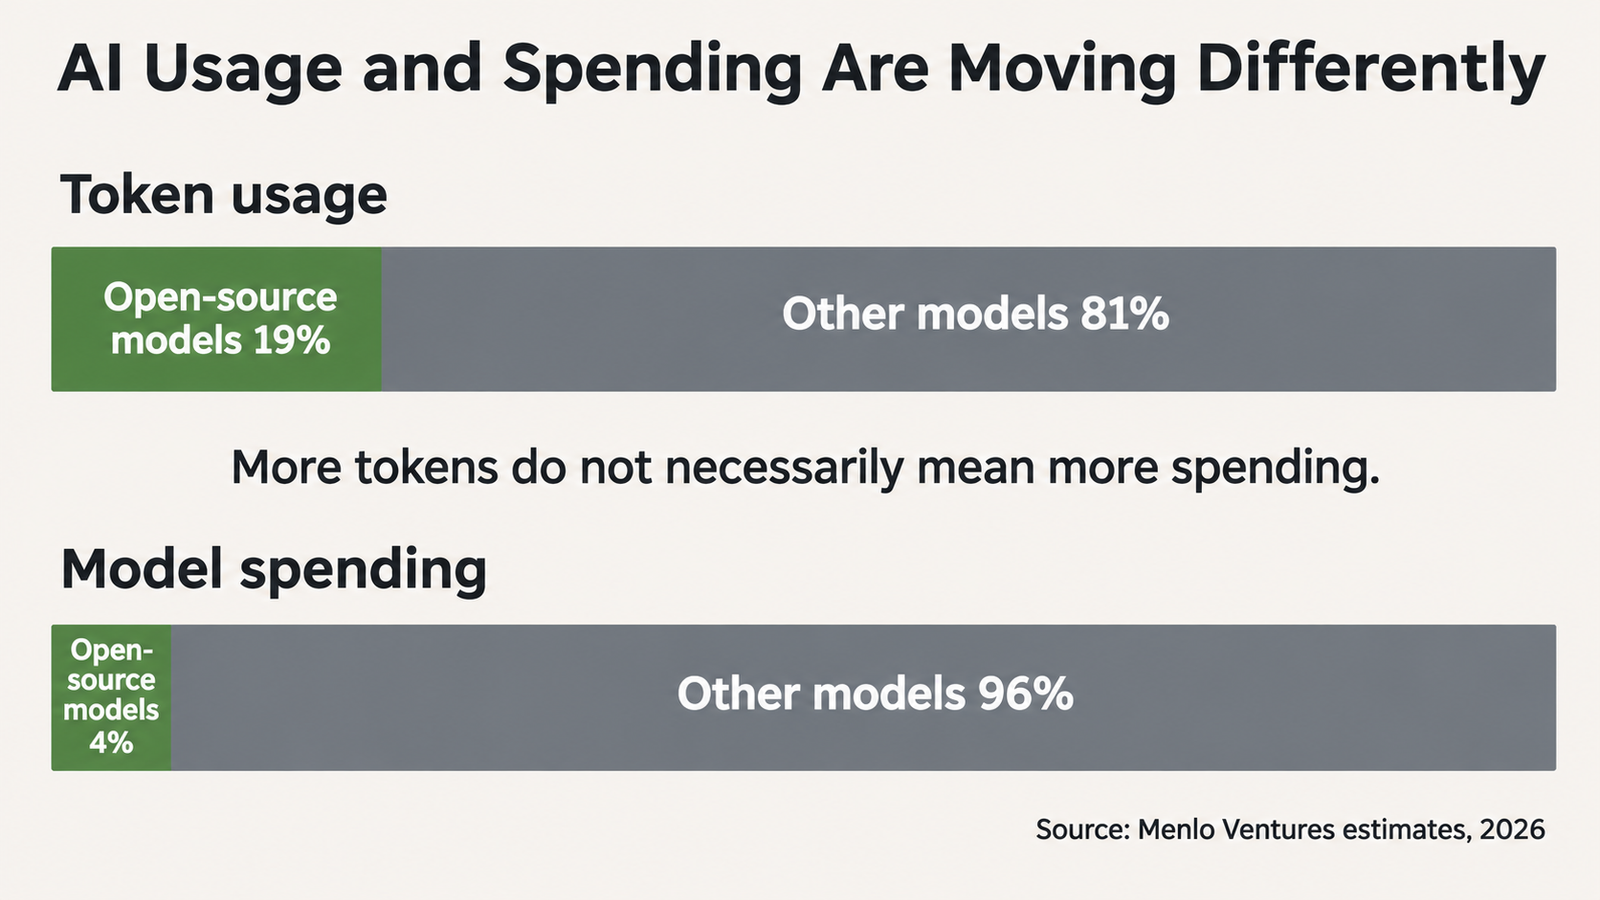
Open-source models do a fifth of the token work for a twenty-fifth of the spending. Menlo Ventures estimates.

Menlo reports that open-source models handled about 19% of tokens but captured only 4% of model spending. Its words: “Open-source is gaining ground in usage, but losing spending share.”

Token economics: 19% of tokens, 4% of enterprise AI spending
Menlo estimateOpen-source modelsAll other models
Share of tokens19%81%
Share of model spending4%96%
Average price per million tokens~$0.13 (open-source average)~$0.70 (closed-model blended)

The arithmetic is worth doing (UniverseBlend analysis). Open-source models earn 4 points of spending for 19 points of tokens, about 0.21 per point. Other models earn 96 for 81, about 1.19 per point. That’s a gap of about 5.6x per token. Menlo’s average prices differ by about 5.4x, $0.70 against $0.13. If both shares describe the same traffic, the spending gap is almost entirely a price gap. Open-source models are doing a growing share of the work. They’re just much cheaper per unit.

A terminology note. Menlo says “open-source”, but most of these models are open-weight: the trained weights can be downloaded, while training data and code often aren’t released. The Open Source Initiative’s Open Source AI Definition requires data information and complete training code as well. And $0.13 is Menlo’s estimated average, not a price every provider charges.

Self-hosting changes the economics again. A company running an open-weight model on its own GPUs pays nothing per token to a model vendor, but it pays for hardware, power, engineering time and idle capacity. Some of that spending shows up as infrastructure rather than model spend. Our comparison of Chinese open-weight models shows how hardware needs vary across popular options.

Why frontier labs keep 69% of enterprise AI spending

Anthropic, OpenAI and Google together hold 69% of enterprise AI deployment spending, about $122.7 billion, up from 50%. On a narrower measure, enterprise LLM API spending, Menlo puts Anthropic at 55% (from 40%), OpenAI at 31% (from 27%) and Google at 9% (from 21%). These are different denominators. Deployment spending includes infrastructure and applications. API spending covers only model calls. Neither is a share of tokens.

A qualification belongs here. Menlo Ventures is an investor in Anthropic and OpenRouter, both central to the report, and it marks portfolio companies with asterisks. The research is valuable primary data. But its authors’ commercial position is relevant to how readers weigh its market-share findings, especially Anthropic’s rise. OpenRouter’s ownership is also changing: Stripe agreed to acquire it in August.

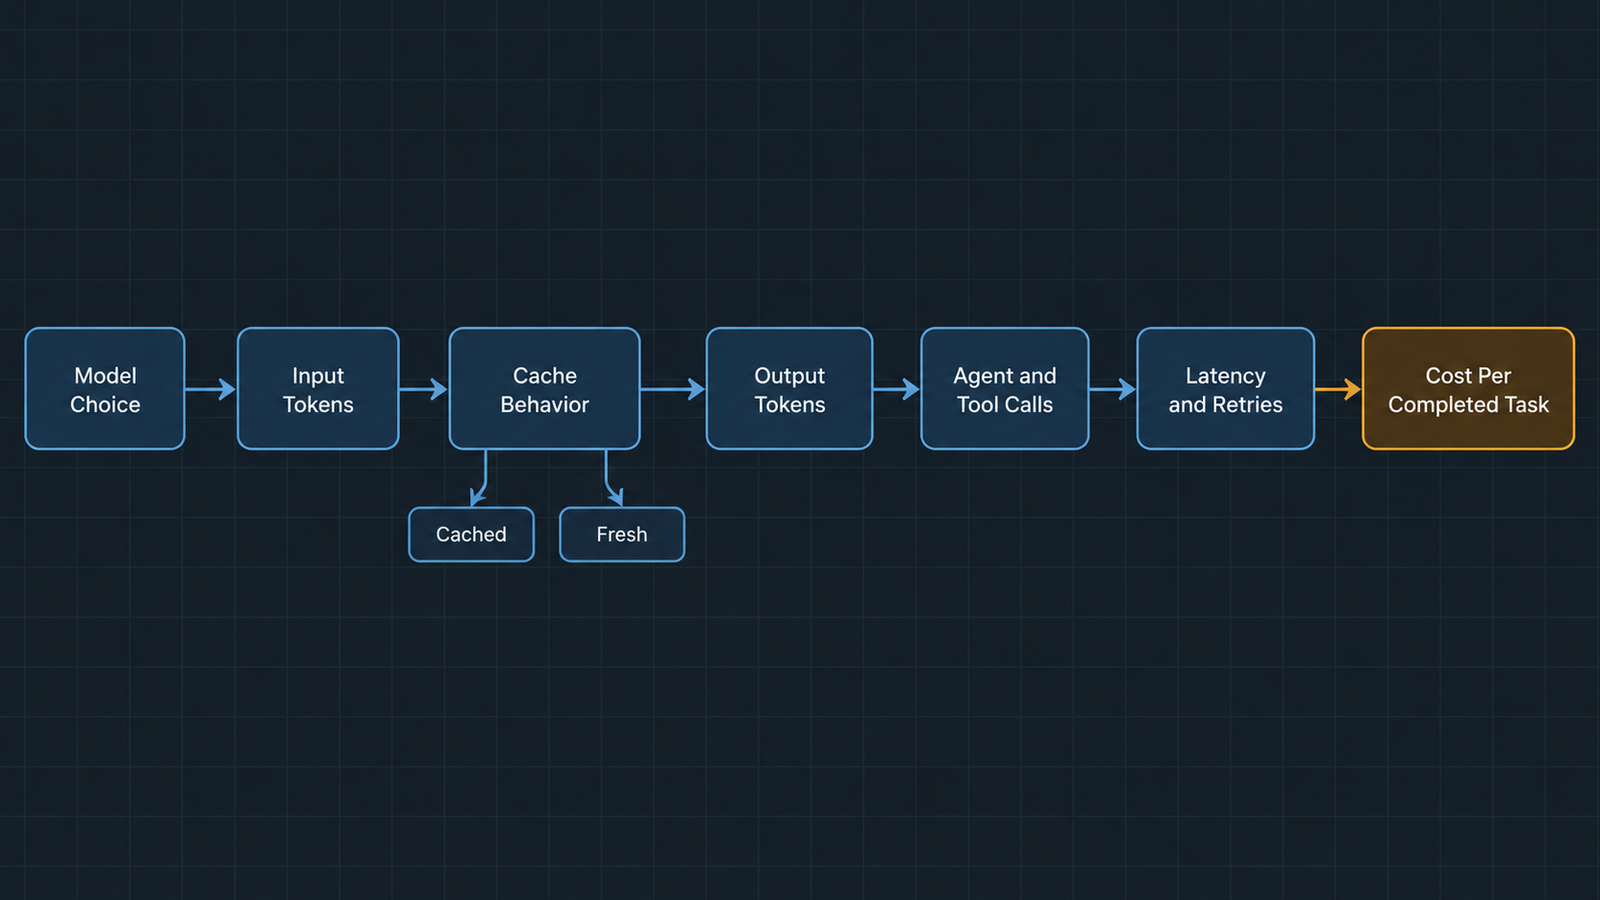
Why pay five times more per token? The report doesn’t measure this directly, so what follows is interpretation. For agentic work, the cost that matters is cost per completed task, not cost per token. A model that finishes a coding task in fewer steps, or without a failed run, can be cheaper overall. Enterprises also pay for reliability, security reviews, existing contracts and integration with tools they already use. The data shows the premium persisting. It doesn’t prove why.

Where the $177B of enterprise AI spending goes

Category (Menlo estimates)Amount
Deployment total$176.8B
Infrastructure$99.5B
Applications$77.3B
of which coding$34.0B
of which assistants and chatbots$25.0B
of which healthcare$3.7B
Development (separate)$102.5B

Infrastructure, the stack that runs models and agents, is the larger half. Within applications, coding and assistants take 76%. Healthcare, in third place at $3.7 billion, is a long way behind.

Why coding leads enterprise AI spending

Coding suits agents better than almost any other job, which is why it dominates enterprise AI spending on applications. The work lives in a repository. Tools are scriptable. Compilers and test suites give fast, objective feedback, so an agent can try, fail, check and retry without a human. Success is easier to define than in a sales forecast or a legal review.

That’s also why coding is expensive. Every test run and retry is more tokens. UniverseBlend’s look at who’s paying for coding agents’ tokens found that the larger cost often comes after generation, in review and rework. Functions with subjective decisions, scattered data or unclear success criteria will adopt agents more slowly, and their spending will grow more slowly too.

Budgets fell behind enterprise AI spending

The budget figures show how badly forecasts missed. Menlo’s survey found:

Survey respondentsPlannedActual
Average spend vs prior year1.9x4.7x
Median spend vs prior year1.8x2.2x

On average, companies spent about 2.5 times what they had planned to grow by. The median company overshot only modestly, about 1.2 times its plan. The gap between average and median means a minority of heavy users is pulling the average up: companies where agents went from pilot to production and consumption took off. It does not mean every company spent 2.5 times its budget.

Most of the growth in enterprise AI spending is new money rather than reallocated budget. Menlo says 55% of incremental AI spending came from new budgets and 22% from existing software budgets. Another 13% came from incumbents converting SaaS licences to AI, and 9%, about $12.6 billion, shifted to AI-native vendors. The report found “limited evidence” of enterprises replacing core systems such as Salesforce’s CRM, Workday or NetSuite. AI is adding to the software bill, not yet replacing it.

What the Menlo report gets right, and what to question

The survey covered nearly 400 US enterprise decision-makers responsible for more than $4 billion in AI spending. Morning Consult fielded it from 8 to 26 September 2026. Market sizes are Menlo estimates built from that survey, public filings and third-party reports, expressed as annualised run rates. That’s a strong dataset for direction and proportion. It isn’t an audited sum of invoices, and it’s US-only.

Three cautions:

  • The baseline was restated. Menlo’s December 2025 report put 2025 enterprise generative AI spending at $37 billion. The new report uses $33 billion for the prior year, after reclassifying data-labelling vendors such as Mercor from deployment to development. On the old base, growth would be about 4.8x.
  • Two datasets are in play. Agent and token findings come from OpenRouter, while budget findings come from the enterprise survey. They shouldn’t be blended.
  • Portfolio relationships run through the market-share findings, as noted above.

None of this makes the report unreliable, and it remains one of the few detailed public estimates of enterprise AI spending. It makes it a well-sourced estimate from an interested party, which is how readers should treat it.

How to budget enterprise AI spending for 2027

The lesson for budget owners is that AI is turning into a consumption line, more like cloud than SaaS. A fixed seat budget can’t predict what agents will cost, because their cost depends on how many tasks they run, how many tokens each task takes and which model does the work.

An illustrative agent budget

Every number here is an assumption, chosen only to show the mechanics. None is a quote from a provider.

Cost lineAssumptionAnnual cost
Employee assistant seats500 seats × $40 a month$240,000
Agent model usage2,000 tasks a day × 1.5M tokens × $1 per million, 250 working days$750,000
Tools and infrastructure20% of model usage (sandboxes, search, vector stores)$150,000
Monitoring and evaluation10% of model usage$75,000
Human reviewNot priced here; often the largest hidden costVaries

The seats are fixed. Everything else moves with volume. If tasks double, or each task takes twice the tokens because agents retry more, model usage rises to $1.5 million. Switch some work to an open-weight model at a fraction of the price and it falls sharply, if quality holds. At Menlo’s $0.70 closed-model average, the same agent line would be $525,000. At a frontier model priced several times higher, it could be millions.

Practical steps follow from that:

  • Budget agents per task, not per user.
  • Track cost per completed task, not per token.
  • Set spending limits per agent.
  • Route routine work to cheaper models.
  • Review forecasts quarterly rather than annually.

The $177 billion headline will be quoted for months. The more useful finding sits underneath it: enterprise AI spending now follows the work AI does, not the number of people who can use it. Tokens will probably keep getting cheaper. Whether bills shrink depends on how many tasks companies hand to agents, how efficiently those agents finish them and which models they run on. Finance teams that still treat AI as a seat count will keep being surprised.

Frequently asked questions

How much is enterprise AI spending in 2026?

Menlo Ventures estimates enterprise AI deployment spending reached $176.8 billion by September 2026, as an annualised run rate. That’s up from a restated $33 billion the year before.

Why has enterprise AI spending increased so quickly?

Existing adopters are using far more AI, largely through agents that consume many tokens per task. Adoption itself rose only from 55% to 65%.

How much enterprise AI spending is driven by agents?

Menlo doesn’t give a dollar figure. On OpenRouter, agents generate about 80% of tokens, but that platform skews towards developers and startups.

Why do AI agents consume more tokens than chatbots?

They work in many steps, resend context each time, read tool outputs, plan, verify and retry. Anthropic measured agents using about four times the tokens of chats.

How much enterprise AI usage comes from open-source models?

About 19% of tokens, according to Menlo, but only 4% of model spending, because their average price is much lower.

Why do frontier AI companies capture most enterprise AI spending?

They hold 69% of deployment spending in Menlo’s estimate. Likely reasons include capability, reliability and integration, though the report doesn’t prove the cause.

What is the difference between AI deployment and development spending?

Deployment spending is money spent using and running AI. Development spending is money spent building models, mainly training compute and data.

How should companies budget for AI agents?

Budget per task, track cost per completed task, set usage limits and review forecasts quarterly, since agent costs vary with volume and model choice.

Are open-weight models cheaper for enterprise use?

Usually per token, yes. Total cost depends on quality, how many retries tasks need, and whether you pay a provider or run your own hardware.

Will enterprise AI spending keep growing?

The report doesn’t forecast 2027. Agent adoption and falling prices push in opposite directions, so the outcome depends on how much work companies hand to agents.


Keep reading

Anthropic IPO valuation

Anthropic IPO: The $895 Billion Question Behind Its Valuation
Last updated: 9 November 2026. Latest confirmed development: Anthropic’s amended S-1, filed on 2 November, still leaves the share count and the IPO price range …
Claude Opus vs Sonnet

Claude Opus vs Sonnet: What the 2026 Price Gap Actually Buys

Last verified: 8 November 2026. All prices are Anthropic’s standard first-party API rates in US dollars per million tokens. They aren’t Claude Pro or Max …
RSA-1024

Did AI Break RSA? What DeepMind Actually Found

Last verified: 8 November 2026. Both papers are unreviewed working papers, and no outside group has reproduced the results yet. No, AI did not break …
Model Distillation

Model Distillation Explained: When AI Learning Becomes Extraction

Last verified: 7 November 2026. Government and company claims are attributed throughout. None has been tested in court. A support team trains a small, cheap …

AMD’s Hybrid AI Math: What the 40–60% Savings Model Assumes

Hybrid AI TCO

AMD says a fleet of 500 AI PCs running half their AI work locally can cost 40 to 60% less over three years than doing all of it through cloud APIs. The company built a calculator to show the arithmetic, which is more than most vendors do.

So the number is checkable. The question is what had to be true to produce it.

Run AMD’s Tokenomics Calculator at its defaults and three assumptions carry most of the weight: a daily token volume that only heavy agentic users reach, prompt caching switched off on the cloud side, and a local model whose quality the tool explicitly declines to compare. Change any one and the percentage moves substantially.

None of that makes the model dishonest. AMD discloses its assumptions more thoroughly than the headline suggests, including a frank exclusions list. But a modeled result under stated assumptions is not a property of hybrid AI, and the useful exercise for a buyer is working out which of those assumptions describe their own workload.

Key takeaways
  • The 40–60% figure is a modeled outcome for one scenario: 500 users at the Medium workload tier, 50% hybrid mix, three-year horizon, July 2026 cloud prices. It is not a general property of hybrid deployment.
  • The Medium tier assumes 5.74 million input and 574,000 output tokens per user per day — roughly 200 input tokens per second sustained across an eight-hour day. That is continuous agent activity, not assisted office work.
  • Prompt caching is supported in the calculator but off by default. Enabling it on a repetitive agentic workload can cut cloud input costs dramatically, which is the single biggest threat to the headline result.
  • At a 50% hybrid mix the calculator buys hardware for every user and runs half the tokens locally. The capital cost is full; the local utilisation is not.
  • AMD states plainly that the calculator does not consider performance needs and excludes model-quality differences, software licensing, IT management, migration, taxes, financing and egress.
  • Local throughput is measured on a quantised 35B open model. Comparing its cost against Claude Opus or GPT 5.5 pricing compares two different things.
  • The defensible conclusion: hybrid AI TCO can produce real savings for high-volume, repetitive, quality-tolerant workloads. Whether it does for you is a measurement question, not a percentage you can inherit.

Quick Navigation


What AMD’s Calculator Actually Models

Hybrid AI TCO is the total cost of running AI workloads across a mix of local hardware and cloud APIs, counting hardware, electricity and token charges over a defined period. AMD’s Tokenomics Calculator models three paths — cloud only, local on AMD devices, and a hybrid split — and reports three-year totals, monthly run rates and break-even months.

The inputs it takes:

InputOptions
Team size25, 250, 1,000 or custom
Analysis period1, 3, 4 or 5 years
Workload tierLight, Medium, Heavy or custom, as tokens per user per day
Cloud model mixGemini Pro $2/$12, Claude Sonnet $3/$15, Claude Opus $5/$25, GPT 5.5 $5/$30, or custom, per million tokens
Hybrid mix0% to 100% local
HardwareRyzen AI 9 HX 470, Ryzen AI Max+ 395, Radeon AI PRO R9700, with editable price, throughput, power and hours per day
EnergyElectricity rate and powered days per month
Cloud modifiersPrompt caching, batch discount, regional multiplier, long-context premium, monthly API surcharge

That is a more complete model than the headline implies, and the advanced panel exposes nearly every assumption for editing. Credit where it is due: the caching, batch and long-context controls exist, and most vendor calculators do not have them.

Three mechanics in the fine print matter more than anything on the main panel.

  1. Cloud cost is API tokens only. AMD states there is no seat, subscription or flat monthly price in the cloud figure. For an organisation actually paying per-seat for a coding assistant, this models a different cost structure than the one on their invoice — sometimes higher, sometimes lower.
  2. Hybrid buys hardware for everyone. At 50% mix, all users get a device and half the token volume runs on it. The hardware line is identical to a full local deployment.
  3. Hardware life equals the analysis period. Choose three years and the full device cost lands inside three years, adjusted by an end-of-life value percentage. There is no refresh cycle and no residual beyond that field.

AMD also prices local throughput from a specific measurement: Qwen 3.6 35B A3B at Q4_K_M quantisation, 262,000-token context prefilled to 128,000, sustained throughput under Vulkan llama.cpp. That is a real benchmark configuration, disclosed, and it is the quiet centre of the whole comparison — because it is the model whose cost is being compared against Claude Opus pricing.

The Token Assumption Does Most of the Work

5.74 million input tokens per user per day sounds abstract. Convert it and it stops being abstract.

Our calculations from AMD’s stated tier, using an eight-hour working day and 260 working days.

UnitInput tokensOutput tokens
Per day5,740,000574,000
Per hour (8h day)717,50071,750
Per second sustained~199~20
Per year~1.49bn~149m
Per 500-user fleet, per year~746bn~75bn

Two hundred input tokens per second, sustained, for every second of every working hour. That is not a person typing prompts. That is an agent running continuously, reading a repository, re-sending context and looping through tool calls.

For scale, 5.74 million tokens is in the region of four million words of input per person per day. No human reads or writes that. Only a machine loop produces it.

Three workload profiles, to show the spread. These are illustrative sketches, not measured data.

ProfileWhat it looks likeRough daily input tokens
Light office AIDrafting, summarising, occasional questionsTens of thousands to low hundreds of thousands
Knowledge worker with AI assistanceRegular use, document context, some retrievalHundreds of thousands to low millions
Continuous agentic codingCoding agent with large repo context, long sessionsMillions to tens of millions

AMD’s own Light tier sits at 574K input, a tenth of Medium. The gap between those two tiers is roughly the gap between a typical office deployment and a developer running a coding agent all day.

Why this dominates the result: cloud cost scales linearly with tokens while hardware cost is fixed. At the Medium tier on Claude Sonnet pricing, one user’s input tokens alone come to roughly $4,470 a year, with output adding about $2,240 — call it $6,700 per user per year, or $20,000 over three years. That is our arithmetic at AMD’s stated tier and prices. Against an AI PC costing one to three thousand dollars, the comparison is not close.

Drop to the Light tier and the same arithmetic yields roughly $670 per user per year. Now a $2,000 device takes about three years to pay for itself before counting electricity, management or anything AMD excludes, and the 40–60% headline does not survive.

The lesson is not that AMD picked an unfair number. It is that tier selection, more than hybrid mix, determines the answer. A buyer starting from the default tier rather than their own metered token volume is reading somebody else’s workload.

Where Prompt Caching Changes the Cloud Side

Here is the tension at the centre of the model. The workload that justifies the Medium tier — a continuous agent re-sending large context — is precisely the workload that prompt caching was designed for.

An agent turn is mostly repetition: the same system instructions, the same tool schemas, the same repository or document context, plus a small amount of genuinely new input. Providers price reused prefixes far below fresh input, and the discount is steep. On current frontier pricing, cached reads land near $0.20 per million tokens against input rates of $2 to $5. We worked through what that does to real bills in our analysis of the cache line that decides agentic costs.

AMD’s calculator supports this. The advanced panel has cache write share, cache read share, a write multiplier (1.25x for a five-minute window, 2x for an hour) and a read multiplier. The controls are there and they are correctly specified.

They are also off by default.

What that means in practice: the following is our illustrative arithmetic, not a calculator output. Take the Medium tier’s 5.74M daily input tokens on Claude Sonnet at $3 per million.

Cache-hit rateEffective input cost per user per dayAnnual input cost per user
0% (calculator default)$17.22~$4,477
50%$9.47~$2,462
80%$4.82~$1,253
90%$3.27~$850

At a 90% hit rate, the cloud input bill falls by roughly 80%. Since input dominates this workload’s token volume, that reshapes the entire comparison — and it reshapes it in the direction that hurts the local case.

The honest counterweight: high cache-hit rates are not automatic. They depend on prefix stability, on how the agent structures its context, on cache window duration against request frequency, and on provider implementation. An agent that rebuilds its context every turn gets little benefit and pays cache-write premiums for the privilege. Assuming 90% is as wrong as assuming zero.

So the correct criticism of AMD’s default is narrow and fair: for the specific workload profile that makes the Medium tier plausible, zero caching is the least likely assumption, and it is the one the tool ships with. Any buyer running this calculator should turn caching on and enter their own measured hit rate before reading the savings number.

The Utilisation Problem on the Local Side

The cloud side of this comparison is perfectly elastic: you pay for tokens consumed and nothing else. The local side is the opposite. You buy a device, and whether it earns its price depends entirely on how much work passes through it.

The calculator handles this more carefully than most. It has an “hrs/day running AI” field per device, it sizes capacity from throughput times that window, and it warns when fleet capacity falls short of token demand. Those are the right mechanics.

What the default scenario still implies is worth making explicit. At a 50% hybrid mix, every user gets a device and half the token volume runs on it. The device’s economic output is therefore half what the same hardware could produce — while its cost is unchanged. In utilisation terms, a 50% hybrid mix is a 50%-utilised fleet, at best.

Hybrid AI TCO

The gap between purchased and productive capacity has several sources, and they compound:

  • AI-active hours are not working hours. A device powered for eight hours may run inference for two.
  • One device per user caps sharing. The calculator states a hard ceiling of one device per user. A heavy user cannot borrow a colleague’s idle capacity.
  • Nights and weekends are free capacity nobody uses. Unless batch or background agent work is scheduled into them, two thirds of each day is idle.
  • Provisioning follows the peak. Hardware sized for the busiest user is over-provisioned for everyone else.
  • Adoption is uneven. Fleet-wide deployment assumes fleet-wide usage. Actual AI adoption inside organisations is famously lumpy.

This is the same economics we set out in our analysis of accelerator utilisation: once capacity is bought rather than rented, idle time stops being an efficiency question and becomes a cost-per-unit question. Every hour the device does not run inference raises the effective cost of the hours it does.

The flip side deserves equal weight, because it is the strongest argument for the local case. A device that runs background agents overnight, processes batch jobs on weekends, or serves a developer who genuinely saturates it can reach utilisation a cloud buyer pays dearly for. Local capacity has no marginal token cost. If you can fill it, you should.

The practical test is simple: measure AI-active hours per user, not headcount. A fleet where ten per cent of staff generate ninety per cent of token volume should not be deployed uniformly, and uniform deployment is exactly what the calculator’s hybrid model assumes.

The Missing Variable: Model Quality

AMD says this plainly, twice, and it deserves to be quoted rather than discovered: the calculator does not consider your performance needs, and model inference quality differences are excluded.

That exclusion is doing a lot of work, because of what is on each side of the comparison. The cloud column is priced from Claude Opus, GPT 5.5, Claude Sonnet or Gemini Pro. The local column is throughput-measured on Qwen 3.6 35B A3B at four-bit quantisation. Both are real. They are not the same capability, and the calculator compares their costs without comparing their outputs.

The economic principle is the one that matters here, and it generalises well beyond AMD:

Cost per token is not cost per completed task.

A cheaper model that needs more attempts can cost more in total. Work the chain through:

  • A task that takes two attempts instead of one doubles the token volume for that task
  • A task that needs human review consumes the most expensive resource in the building
  • A wrong output that reaches a downstream system costs far more than either
  • A longer reasoning path to the same answer burns more tokens on cheaper hardware

The arithmetic that follows is unforgiving. If a local model completes 70% of tasks that a frontier model completes at 95%, the effective cost per completed task rises by roughly a third before counting retries — and that is before anyone prices the human time spent on the failures.

None of this says local models are inadequate. Open models at 30B-class sizes have become genuinely capable, and for classification, extraction, summarisation, routing and structured transformation they are often indistinguishable from frontier models at a fraction of the cost. That is a real and growing category of work.

The point is narrower: a TCO model that excludes quality is answering “what does this cost?” rather than “what does this deliver per pound spent?” For the tasks where the two models are equivalent, AMD’s comparison is fair. For the tasks where they are not, the cost column is measuring the wrong thing — and the calculator cannot tell you which tasks are which. Only your own evaluation can.

Why 50/50 Is a Modeling Choice, Not a Strategy

The hybrid mix slider defaults to 50%. It is a reasonable midpoint for a demonstration and a poor description of how workloads actually divide.

Real routing is decided by task characteristics, not by percentages:

Route locallyRoute to cloud
Classification, extraction, taggingComplex multi-step reasoning
Summarisation of routine documentsNovel problem-solving
Privacy-sensitive or regulated dataTasks needing the newest model capabilities
High-volume repetitive transformationBurst workloads above local capacity
Offline or air-gapped workAnything where a wrong answer is expensive
Draft generation before human editingFinal output that ships unreviewed

Run that split against a real workload and the local share lands wherever it lands — 15%, 40%, 80%. The number is an output of the routing policy, not an input to it. An organisation doing mostly structured data work might route 80% locally. One doing mostly open-ended analysis might manage 20%.

This also explains why the calculator’s “max potential savings at 100% hybrid” figure should be read carefully. Full local means no access to frontier capability at all, which is a product decision rather than a cost optimisation.

What AMD’s Model Gets Right

Credit where it is earned, because the tool is better than the headline it generated.

  • It discloses its assumptions. Token tiers, model prices with a date, electricity rate, throughput test configuration, device specs — all visible and editable.
  • It publishes an exclusions list. Model quality, licensing, IT management, migration, taxes, financing, egress, volume discounts. Most vendor calculators omit this entirely.
  • It includes the modifiers that matter. Caching, batch discounts, long-context premiums and regional multipliers are all present, even if off by default.
  • It flags capacity shortfalls. If the fleet cannot serve the token demand, it says so and routes the overflow to cloud.
  • It states its own limitation on performance. “This calculator does not consider your performance needs” is an unusually honest sentence to put in a sales tool.
  • The underlying economics are sound. For sufficiently high, sufficiently repetitive token volumes, local inference genuinely is cheaper. That is not marketing; it is arithmetic.

What It Leaves Out That Could Matter

The exclusions are disclosed, but not all of them are equally consequential. Ranked by how much they could move a real result:

ExclusionWhy it mattersDirection
Model qualityChanges cost per completed task, not cost per tokenUsually favours cloud
Caching, when left offOverstates cloud input costs on repetitive workloadsFavours local as shipped
IT management and supportManaging local inference across a fleet is real workFavours cloud
Software licensingLocal serving stacks, management tooling, model licencesFavours cloud
Migration and deploymentOne-off but substantial for a 500-device rolloutFavours cloud
Hardware refreshLife is set to the analysis period; a 5-year window assumes 5-year devicesFavours local as shipped
Volume discountsEnterprise cloud agreements rarely pay list priceFavours cloud
Seat and subscription pricingMany organisations pay per seat, not per tokenDepends
Utilisation below 100%Capacity bought is not capacity usedFavours cloud

Notice the pattern. Most of the exclusions push in the same direction, and it is not the direction that makes local hardware look better.

A Better Hybrid AI TCO Calculation

Ten steps. The first four are measurement, and skipping them is how buyers end up with somebody else’s answer.

  1. Meter your actual token consumption. Pull it from provider dashboards or your gateway logs, not from headcount multiplied by an assumption.
  2. Separate input from output. They price differently and they scale differently. Input dominates agentic work; output dominates reasoning work.
  3. Measure your cache-hit rate. Most providers report cached-token usage. This single number may move your cloud bill more than any hardware decision.
  4. Measure AI-active hours per user, not working hours, and look at the distribution rather than the average.
  5. Classify tasks by quality requirement. Which actually need a frontier model? Test, do not assume.
  6. Calculate realistic local utilisation. Include nights, weekends and the users who barely touch AI.
  7. Add the omitted costs. Management, support, licensing, migration, refresh.
  8. Compute cost per completed task for both paths, including retries and human review.
  9. Test several routing mixes — 0%, 25%, 50%, 75%, 100% — rather than accepting the default.
  10. Run sensitivity on your two or three largest variables and see how wide the range gets.

Sensitivity: Which Assumptions Move the Answer

Directional, based on the model’s structure rather than on outputs we cannot reproduce exactly.

If this changesLocal and hybrid TCOWhy
Token volume risesImproves sharplyCloud scales linearly, hardware does not
Token volume fallsDeteriorates sharplyFixed hardware cost spread over less work
Cache-hit rate risesDeterioratesCloud input cost falls, sometimes by 80%+
Local utilisation risesImprovesSame capital, more output
Cloud API prices fallDeterioratesThe savings baseline shrinks
Electricity price risesDeteriorates mildlyPower is a small share at these volumes
Hardware price fallsImprovesLower capital to amortise
Quality requirements riseDeterioratesMore work must route to cloud regardless of cost
Refresh cycle shortensDeterioratesCapital amortised over fewer years
Hybrid mix rises toward 100%Improves on cost, narrows on capabilityFewer tokens billed, less frontier access

The two largest levers are token volume and cache-hit rate, and they pull in opposite directions on the same workload. That is the central tension in AMD’s model: the workloads with enough tokens to justify local hardware are the workloads most likely to benefit from caching.

FAQ

What is hybrid AI TCO?

The total cost of running AI workloads across both local hardware and cloud APIs over a defined period, counting hardware purchase, electricity and token charges. It differs from cloud-only TCO because part of the cost becomes fixed capital rather than metered usage.

Can hybrid AI really reduce AI costs by 40–60%?

AMD’s calculator produces that result for a specific scenario: 500 users at 5.74 million input and 574,000 output tokens per user per day, a 50% local mix, a three-year horizon and July 2026 cloud prices with prompt caching off. Under those assumptions the arithmetic holds. Whether it holds for a given organisation depends on whether its workload resembles that profile.

Is local AI cheaper than cloud AI?

For high-volume, repetitive, quality-tolerant workloads on well-utilised hardware, frequently yes. For light or intermittent usage, usually no, because fixed hardware cost is spread across too little work. The crossover point is set by token volume, utilisation and the cache-hit rate on the cloud side.

How does prompt caching affect hybrid AI TCO?

Significantly, and against the local case. Cached input tokens are priced far below fresh ones, so a repetitive agentic workload with a high hit rate can cut its cloud input bill by most of its value. AMD’s calculator supports caching but ships with it disabled, which prices every input token at full rate.

How much does AI PC utilisation affect TCO?

Proportionally. A device used half as much has roughly double the effective cost per unit of work, since the purchase price does not change. At a 50% hybrid mix the calculator buys hardware for every user and runs half their tokens locally, which is a 50%-utilised fleet by construction.

What costs are missing from AMD’s AI cost calculator?

AMD lists them: model inference quality differences, software licensing, IT management, migration effort, taxes, financing fees, network and egress costs unless entered manually, and provider-specific volume discounts. Most of these, if included, would favour the cloud side.

Is a 50/50 local and cloud split optimal?

It is a default, not an optimum. The right mix follows from task routing — which work genuinely needs frontier capability and which does not — and lands anywhere from 15% to 80% local depending on the workload.

How should businesses calculate AI TCO?

Start by metering actual token consumption split into input and output, measure the cache-hit rate and AI-active hours per user, classify which tasks need frontier models, then compute cost per completed task for several routing mixes rather than cost per token for one.

Does AMD’s calculator compare equivalent models?

No, and it says so. Local throughput is measured on Qwen 3.6 35B A3B at four-bit quantisation, while cloud costs are priced from Claude, GPT and Gemini models. AMD states explicitly that the tool does not consider performance needs.


Keep reading

Anthropic IPO valuation

Anthropic IPO: The $895 Billion Question Behind Its Valuation

Last updated: 9 November 2026. Latest confirmed development: Anthropic’s amended S-1, filed on 2 November, still leaves the share count and the IPO price range …
Claude Opus vs Sonnet

Claude Opus vs Sonnet: What the 2026 Price Gap Actually Buys

Last verified: 8 November 2026. All prices are Anthropic’s standard first-party API rates in US dollars per million tokens. They aren’t Claude Pro or Max …
RSA-1024

Did AI Break RSA? What DeepMind Actually Found

Last verified: 8 November 2026. Both papers are unreviewed working papers, and no outside group has reproduced the results yet. No, AI did not break …
Model Distillation

Model Distillation Explained: When AI Learning Becomes Extraction

Last verified: 7 November 2026. Government and company claims are attributed throughout. None has been tested in court. A support team trains a small, cheap …

GPT-6 Sol vs Claude Opus 5.5: What the 50% Cut Misses

GPT-6 Sol vs Claude Opus 5.5

On September 22, 2026, Anthropic cut the price of its flagship Opus tier. Ninety minutes later, OpenAI halved the price of two GPT-6 models. Both announcements led with a percentage.

Percentages are the wrong unit. The invoice is denominated in tasks, and a task is a bundle of cached input, fresh input, output tokens, tool calls, retries and occasional failures that reach production. Change the mix and a 50% token-price cut can produce anything from a 50% saving to almost none.

This is a comparison of GPT-6 Sol vs Claude Opus 5.5 by workload shape rather than by rate card. The short version: the line that decides most agentic bills is the cached-input read, and on that line the two models are now priced identically.

Key takeaways

  • Both models landed on September 22, 2026, about 90 minutes apart. GPT-6 Sol lists at $2/$10 per million input/output tokens; Claude Opus 5.5 at $4/$20.
  • Cache reads are $0.20 per million on both. On cache-heavy agent workloads, the headline 2:1 token-price gap compresses sharply.
  • The two “cheaper” claims use different baselines. OpenAI’s 50% is measured against GPT-5.6 promotional pricing; Anthropic’s 20% is against Opus 5, with the larger 40% figure resting on token efficiency at default settings.
  • Output tokens, not input, dominate reasoning-heavy bills. A model that thinks longer can cost more per task at a lower per-token price.
  • Neither company published a symmetric head-to-head. OpenAI benchmarked Sol against Claude Opus 5 and, where 5.1 numbers were missing, Fable 5, using competitor scores from published reports.
  • Token prices fell while memory prices rose: TrendForce recorded conventional DRAM contract prices up 93–98% quarter over quarter in Q1 2026 before moderating to 13–18% in Q3.
  • The only reliable comparison is your own traffic. Cost per completed task, measured on 50 real inputs, beats any published rate card.

Quick Navigation


GPT-6 Sol vs Claude Opus 5.5: The Numbers Everyone Is Comparing

Here is what each company published, kept in separate categories, because list price, promotional price, batch price and cached price are not interchangeable.

Line item (per 1M tokens)GPT-6 SolClaude Opus 5.5
Input$2.00$4.00
Output$10.00$20.00
Cached input read$0.20$0.20
Cache write (5-min)No separate charge published$5.00
Cache write (1-hour)Not applicable$8.00
Batch50% off$2.00 / $10.00
Fast / premium modeNot offered at this tier$8.00 / $40.00
PredecessorGPT-5.6 Sol at $4 / $20Claude Opus 5 at $5 / $25

OpenAI’s announcement states the reduction plainly: Sol moves from $4/$20 to $2/$10 and Luna from $0.20/$1.20 to $0.10/$0.50, a 50% cut against GPT-5.6 promotional pricing, attributed to caching and inference improvements the company says it is passing on. Cached input-token reads carry a 90% discount, which puts Sol’s cached reads at $0.20.

Anthropic’s Opus 5.5 lists at $4 input and $20 output, down from Opus 5’s $5 and $25, with cache reads falling from $0.50 to $0.20 and five-minute cache writes from $6.25 to $5. Anthropic told reporters the model runs about 40% cheaper than Opus 5 at default settings, combining the 20% token-price cut with fewer tokens consumed per task.

Two caveats before anyone builds a spreadsheet on these numbers. OpenAI’s baseline is a promotional rate, not a long-standing list price, so “50% cheaper” compares against a discount that was already in force. An OpenAI spokesperson told VentureBeat the new rates are permanent rather than promotional; that is a company statement, not something a buyer can verify from outside. And Anthropic’s 40% is a blended claim about workloads, not a line on the rate card — the rate card says 20%.

Verify both against the live pricing pages before you commit a budget. Rate cards move, and the ones above were published on launch day.


Where the GPT-6 Sol vs Claude Opus 5.5 Savings Actually Come From

A price cut can arrive through three different doors, and they behave differently on your invoice.

  • Door one: the per-token rate. This is the headline. It applies uniformly to every token of the relevant class, so a 50% cut here does produce a 50% saving — but only on the portion of the bill made of tokens priced at that rate.
  • Door two: the discount structure. Cached reads, batch processing and long-context surcharges change which rate applies to which tokens. This door moves more money than the first one on most production workloads, and almost nobody reads it.
  • Door three: token efficiency. If a model completes the same task using fewer output tokens, the bill falls without any rate changing. Anthropic leaned on this explicitly, saying Opus 5.5 generates output faster and uses fewer tokens per task. Efficiency claims are the hardest to verify from outside, because they depend on your prompts and your effort settings.

The distinction matters because doors two and three are workload-dependent, while door one is not. Two teams on identical rate cards can see completely different savings.


The Cache Line That Changes the GPT-6 Sol vs Claude Opus 5.5 Math

Cached input reads cost $0.20 per million tokens on both models. That single equality does more to determine competitive cost than the 2:1 gap on list input price, because of what modern agents actually send.

An agent turn is mostly repetition. The system instructions, the tool schemas, the retrieved documents, the repository context and the conversation so far all get resent on every turn. Only the newest user message and the model’s reply are genuinely new. On a long-running agent, cached tokens routinely outnumber fresh ones by an order of magnitude.

Work through what that does to a single turn. Take 100,000 tokens of reused prefix, 5,000 tokens of new input and 1,500 tokens of output. This is a worked example, not a measurement.

ComponentGPT-6 SolClaude Opus 5.5
100,000 cached input$0.0200$0.0200
5,000 fresh input$0.0100$0.0200
1,500 output$0.0150$0.0300
Turn total$0.0450$0.0700

Sol is about 36% cheaper on that turn, not 50%. Now run the same prefix uncached: 105,000 input tokens cost $0.21 on Sol against $0.42 on Opus 5.5, and the full 2:1 ratio returns — along with a bill roughly five times larger on both.

The caching mechanism differs in ways that matter operationally. OpenAI applies caching automatically to eligible reused prefixes within a rolling window and publishes no separate write charge, while giving developers explicit breakpoints, a caching dashboard and a diagnostics tool, plus the ability to change reasoning effort or toggle tools mid-conversation without invalidating the cached prefix. Anthropic charges for cache writes — $5 per million for the five-minute window, $8 for the one-hour window — which means the break-even depends on how many reads each write earns.

That write charge is not a disadvantage so much as a different shape. A prefix written once and read forty times amortizes cheaply. A prefix written once and read twice does not. If your agent rebuilds its context frequently, model the writes explicitly.

The efficiency gains are real on the provider side too. OpenAI says GitHub reported that its caching improvements cut the share of prompt tokens needing fresh processing by more than half, measured across billions of requests. That is a claim about one large customer’s traffic, reported by OpenAI, and it says nothing about what your cache-hit rate will be.


Five Workload Shapes Where GPT-6 Sol vs Claude Opus 5.5 Diverges

Every calculation below is a labelled hypothetical built from published rates. None of it is measured production data, and your token counts will differ.

1. Long-context agentic work

A research or operations agent holding 150,000 tokens of context, running 12 turns, producing 2,000 output tokens per turn. Most input is cached after the first turn.

The cached portion is priced identically on both, so the comparison collapses to output and fresh input. Sol’s advantage is real but roughly a third, not a half. Anthropic’s cache-write charge applies on each rebuild of the prefix; if the agent’s context shifts every few turns, add $0.75 per rebuild on a 150,000-token prefix at the five-minute rate.

2. High-volume classification and extraction

Short inputs, short outputs, millions of requests, little or no reuse. Say 800 input tokens and 120 output tokens per call, 5 million calls a month.

GPT-6 SolClaude Opus 5.5
Input, 4B tokens$8,000$16,000
Output, 600M tokens$6,000$12,000
Monthly total$14,000$28,000

This is the shape where the headline ratio holds exactly, because nothing is cached and nothing is reasoned about at length. It is also the shape where neither of these models is the right answer — GPT-6 Luna at $0.10/$0.50 would run the same volume for roughly $700, and the real question is whether its accuracy clears your threshold.

3. Coding agents with heavy cache reuse

A coding agent maintaining 200,000 tokens of repository context across 30 turns, 1,500 output tokens per turn, cache hit rate above 90%.

Here the bill is dominated by cached reads at $0.20 on both sides, plus output. Sol wins on output price; Opus 5.5 wins if Anthropic’s token-efficiency claim holds on your tasks, because fewer thinking tokens beats a lower price per thinking token. This is precisely the case where the rate card cannot answer the question and a measured test can.

4. One-shot generation

20,000 tokens in, 2,000 out, no reuse. Sol costs $0.06, Opus 5.5 costs $0.12. Clean 2:1, and the absolute numbers are small enough that the choice should probably rest on output quality rather than price.

5. Repeated multi-step agent loops

The shape where estimates go wrong. Ten tool calls per task, each one a model round trip, each carrying the accumulated trace. Costs compound with the square of the loop length as the transcript grows, and a single retried loop can double a task’s cost.

This is also where reasoning-token volume bites. Independent testing reported by Artificial Analysis put Opus 5.5 at the top of its Intelligence Index as of September 22, while consuming roughly 119,000 output tokens per task against about 73,000 for Opus 5 and 27,000 for GPT-6 Astra. Read carefully: that is a cross-model figure from one evaluation suite, not a measurement of your agent. But it illustrates the mechanism — a model that reasons longer can produce a larger bill at a lower per-token rate, and the effort setting you choose moves this number more than the rate card does.

The pattern

GPT-6 Sol vs Claude Opus 5.5
Workload shapeWhere cost concentratesDoes the 2:1 price gap hold?
Long-context agenticCached reads, outputNo, compresses sharply
High-volume extractionFresh input, outputYes
Coding agent, high reuseCached reads, outputNo, and token efficiency may reverse it
One-shot generationFresh input, outputYes
Multi-step loopsOutput, retriesUnpredictable without measurement

Why Infrastructure Costs Tell a Different Story

Token prices halved in September. The inputs to serving those tokens did not.

Memory is the clearest case. TrendForce’s contract-price surveys recorded conventional DRAM rising roughly 93–98% quarter over quarter in Q1 2026, lifting industry revenue 81% to about $97 billion, followed by a further 58–63% in Q2. By Q3 the increase moderated to 13–18% quarter over quarter, with server DRAM undersupplied and suppliers prioritising AI and server allocations. Moderating growth on top of two near-doublings is still a much higher price than a year earlier.

Keep the categories distinct, because they are not substitutes and they do not move together:

CategoryWhat it isWhere it sits
Conventional DRAMStandard DDR5 memoryServer main memory, consumer devices
Server DRAM / RDIMMRegistered modules for serversHost memory beside accelerators
HBMStacked high-bandwidth memoryOn the accelerator package
GPU memoryThe HBM attached to a specific acceleratorHolds weights and KV cache

HBM is allocated separately from conventional DRAM and priced separately, but they compete for the same wafers. TrendForce noted suppliers reallocating capacity toward HBM and server products, which is part of why commodity memory repriced so violently.

So how do providers cut prices into that? Three mechanisms, none of which requires hardware to get cheaper: better utilisation of accelerators already deployed, architectural and serving efficiency improvements, and margin. OpenAI attributes its reduction to caching and inference improvements. That is a credible mechanism and also a commercial decision — Ramp’s lead economist described the two labs as fighting a price war that is driving down both AI prices and their own ability to profit from it.

The useful inference for a buyer: today’s rate card reflects a competitive position, not a cost floor. Build your model so a rate change in either direction does not invalidate it.


Memory Is Becoming Part of the Token Price

Generating tokens is a memory-bound problem, and that is why caching is priced the way it is.

During decoding, the accelerator reads the model weights and the KV cache — the stored attention state for every token in the context — for each token it produces. Arithmetic units sit idle waiting for data. Throughput is governed by how fast bytes move out of HBM, not by peak FLOPS.

That has three consequences for anyone reading a price sheet.

  1. Context length is a memory cost, not just a token cost. KV cache size grows linearly with context. A 200,000-token prefix occupies real HBM for the duration of the request, and that capacity cannot serve anyone else. This is why long-context tiers carry surcharges: reported pricing for Sol applies a 2x input and 1.5x output multiplier above 272,000 input tokens, which is worth confirming against the API docs if your workload runs long.
  2. A cache read is cheap because the expensive part already happened. The prefill computation that built the attention state was paid for on the write. The read reuses stored state, which is closer to a memory-and-storage operation than a compute one. That is the physical reason both vendors landed near $0.20 rather than near their input prices.
  3. Batching is where provider economics live. Serving many requests concurrently amortises the weight reads across more output tokens. Latency-sensitive, low-batch workloads are the expensive ones to serve, which is why batch APIs carry 50% discounts and why fast modes cost double.

None of this changes what you are billed per token. It explains why the structure of the price sheet looks the way it does, and why the cheap line is cheap.


The GPT-6 Sol vs Claude Opus 5.5 Benchmark Comparison Has a Catch

Neither company published a head-to-head against the other’s new model. They could not have: the two launched ninety minutes apart.

OpenAI’s comparisons are mostly cost per task rather than cost per token, which is the right unit, and they name Anthropic repeatedly. On AutomationBench 1.0.6, GPT-6 Sol at xhigh effort scored 33.2% at $0.27 per task, against Claude Opus 5 at max effort on 26.9% at 11.1 times Sol’s cost per task. On DeepSWE v1.1, Sol at max effort scored 68.8%, within 1.1 points of Claude Fable 5’s 69.9% at xhigh, at roughly 80% lower cost per task. On OSWorld 2.0 offline, Sol at xhigh scored 60.5% against Opus 5 at medium on 60.3%, again at about 80% lower cost.

Read OpenAI’s own footnotes before reading the charts. The company states that competitor scores were taken from publicly available reports rather than run in-house, and that Claude Fable 5 scores stood in where Fable 5.1 numbers were unavailable. It also notes that its Fable 5.1 AutomationBench datapoint understates that model’s real cost, because it omits the Opus 5 fallbacks that fired on roughly 40% of tasks.

So the baseline is Claude Opus 5, the model Opus 5.5 replaced. None of those comparisons touch Opus 5.5.

Anthropic’s side has the mirror problem. Its launch table put Opus 5.5 at 66.4% on Terminal-Bench 4.0 against 52.3% for Opus 5 and 57.9% for GPT-6 Astra — a different benchmark, a different generation of competitor, and a different effort configuration.

Three things make these numbers non-comparable:

  • Different baselines. OpenAI measured against Opus 5 and Fable 5; Anthropic measured against Opus 5, Fable 5.1 and GPT-6 Astra.
  • Different effort settings. “xhigh”, “max” and “medium” are not equivalent, and effort drives both score and cost. A comparison at mismatched effort levels is a comparison of two configurations, not two models.
  • Different evaluation suites and versions. AutomationBench 1.0.6, DeepSWE v1.1, OSWorld v2026.08.08 and Terminal-Bench 4.0 measure different things.

Company-reported results are evidence about what a vendor could demonstrate under conditions it chose. Independent head-to-head evaluation is a different category, and at the time of writing the independent picture is thin — Artificial Analysis had run both, placing Opus 5.5 at the top of its Intelligence Index on September 22, at a notably high output-token cost per task.

We are not declaring a winner on this evidence, because the evidence does not support one. What it does support is narrower and more useful: cost per task varies by an order of magnitude across effort settings on the same model, which means your effort configuration is a bigger cost lever than your model choice.


Run the 50-Request GPT-6 Sol vs Claude Opus 5.5 Test

Take 50 representative inputs from your actual traffic — not curated examples, not the ones you already know work — and run them through both models at the effort settings you would ship. Then measure eight things:

  1. Cost per request, broken into cached input, fresh input and output
  2. p95 latency, not mean latency
  3. Output tokens consumed per request
  4. Cache-hit rate and cache-read volume
  5. Retry rate
  6. Failure rate
  7. The split between obvious failures and silent ones
  8. Task completion rate against your own definition of complete

Call this a practical screening experiment. Fifty inputs will not give you statistical confidence, and anyone who tells you otherwise is selling something. What it will give you is the distribution shape: whether one model’s costs cluster tightly while the other’s have a long tail, whether failures announce themselves or slip through, and whether the effort setting you assumed is the right one.

Fifty is enough to catch the things leaderboards structurally cannot show you. Benchmarks report aggregate accuracy on someone else’s task distribution. They do not report what happens when your particular malformed PDF arrives, or how many output tokens your prompt style provokes, or whether the model quietly returns a plausible wrong answer instead of an error.

Run it again after any prompt change. Cache-hit rates are fragile, and a small edit to a system prompt can invalidate a prefix and quietly multiply your input bill.


A Practical Cost Model for GPT-6 Sol vs Claude Opus 5.5 Buyers

Cost per million tokens is not cost per completed business task. Here is the arithmetic that gets you from one to the other.

Cost per request = (cached input tokens × cache-read rate) + (fresh input tokens × input rate) + (cache-write tokens × write rate) + (output tokens × output rate)

Cost per completed task = (cost per request × requests per task × (1 + retry rate)) ÷ task completion rate

The denominator is what most spreadsheets omit. A model that completes 90% of tasks costs you 1.11 times its nominal per-task price, before anyone accounts for the human who handles the other 10%.

Measure these inputs before you model anything:

InputWhy it matters
Input tokens per requestSets the base, and splits into cached and fresh
Cached input tokens per requestThe line priced identically across both models
Cache-hit rateMoves the bill more than the rate card does
Output tokens per requestDominates reasoning-heavy workloads
Requests per taskAgent loops multiply everything upstream
Retry rateAdds cost without adding completions
Task completion rateConverts cost per request into cost per outcome
p95 latencyDetermines whether batch pricing is available to you
Tool-call countEach call is another round trip carrying the transcript

Two structural options are worth testing before you negotiate anything. Batch processing is half price on both platforms and is available to any workload that tolerates delay — reporting, enrichment, overnight classification. And tiering is usually cheaper than choosing: route the easy majority to a small model and reserve the expensive tier for what needs it. GPT-6 Luna at $0.10/$0.50 exists precisely for that split.


Failure Shape: Where Cheap Tokens Get Expensive

Two models can post the same accuracy and impose completely different operational costs, because accuracy is a count and failure is a distribution.

Five failure types, in rough order of how much they cost you:

TypeWhat it looks likeWho absorbs it
Explicit refusal or errorThe call fails visiblyYour retry logic
Partial completionHalf the job, clearly incompleteA human, quickly
Tool-use failureThe agent loops or stalls on a callYour token budget
Plausible but wrong outputConfident, well-formatted, incorrectA reviewer, if you have one
Wrong output reaching a downstream systemNobody notices until laterThe business

The first three are cheap because they are loud. They cost tokens and latency, both of which show up in the metrics you already watch.

The last two are the expensive ones, and their cost has nothing to do with token prices. An incorrect classification that routes a support ticket wrongly costs a few minutes. An incorrect figure in a financial summary that someone acts on costs considerably more. An incorrect medical code creates a billing and compliance problem that surfaces weeks later. An incorrect customer email cannot be recalled. An incorrect code change that passes review reaches production.

Run the arithmetic on a realistic case. A workload processing 100,000 tasks a month at $0.05 per task costs $5,000. A silent error rate of 0.5% produces 500 wrong outputs. If each one costs $50 to detect and remediate — a conservative figure in regulated work — that is $25,000, five times the inference bill. Halving the token price saves $2,500. Halving the silent error rate saves $12,500.

That is the whole argument for measuring failure shape before optimising price.

We are not claiming either model has a particular failure tendency; the published evidence does not support that kind of claim, and failure profiles are heavily prompt-dependent. OpenAI does report that Sol makes about half as many factual mistakes as GPT-5.6 Sol on an internal evaluation, while noting that the evaluation is drawn from conversations users flagged as erroneous and is not representative of typical use. That is a claim about one model against its own predecessor, on a deliberately error-prone set.

What matters for your decision is which failure types your architecture can absorb. If a human reviews every output, plausible-but-wrong is survivable. If the output writes to a ledger, it is not, and you should be paying for whatever reduces it.


What the Price War Actually Changed

Three things changed on September 22, and two things did not.

  • Changed: the floor for frontier-adjacent capability. Work that cost $4 per million input tokens in August costs $2 now on OpenAI’s side, and the Opus tier came down 20%. That is real, and it makes workloads viable that were not.
  • Changed: cache reads became a commodity. At $0.20 on both platforms, the cached-input line is no longer a differentiator. Vendors now compete on hit rates, cache controls and write economics rather than on the read price itself.
  • Changed: the unit of comparison. OpenAI’s own announcement leads with cost per task rather than cost per token. When the seller changes units, the buyer should too.
  • Unchanged: the cost of being wrong. Nothing in either rate card touches remediation.
  • Unchanged: the direction of infrastructure costs. Memory repriced upward through 2026 while token prices fell. Providers are absorbing that gap through efficiency and margin, which means today’s prices reflect a competitive moment rather than a durable cost structure.

The practical conclusion for a buyer comparing GPT-6 Sol vs Claude Opus 5.5 is unglamorous. Instrument your workload, measure cached versus fresh input, measure output tokens at the effort setting you will actually ship, and compute cost per completed task rather than cost per million tokens. The rate card is the least informative document in this decision.


Frequently Asked Questions

Which is cheaper, GPT-6 Sol or Claude Opus 5.5?

On list price, Sol at $2/$10 per million tokens is half of Opus 5.5 at $4/$20. On a cache-heavy agent workload the gap narrows substantially, because cached reads cost $0.20 on both. On any workload, the answer depends on output-token volume at your effort setting.

Do cache reads really cost the same on both?

Yes, at $0.20 per million tokens as of the September 22, 2026 launches. The structures differ: OpenAI applies a 90% cached-read discount automatically within a reuse window and publishes no separate write charge, while Anthropic charges $5 per million for a five-minute cache write and $8 for a one-hour write.

Why doesn’t a 50% price cut halve my bill?

Because only the tokens priced at the cut rate get the discount. Cached reads, batch-processed tokens and long-context surcharges follow different lines, and retries, tool calls and failed tasks add cost that no rate card mentions.

What does cache-hit rate do to cost?

More than almost anything else. Moving 100,000 tokens of prefix from fresh to cached takes that line from $0.20 to $0.02 on Sol, and from $0.40 to $0.02 on Opus 5.5. Small prompt edits can invalidate a prefix and silently reverse the saving.

How should I price long-context workloads?

Count the KV cache, not just the tokens. Long prefixes occupy accelerator memory for the life of the request, which is why surcharges exist above certain thresholds — reported at 2x input and 1.5x output above 272,000 input tokens for Sol. Confirm current thresholds in the API documentation.


Keep reading

Anthropic IPO valuation

Anthropic IPO: The $895 Billion Question Behind Its Valuation

Last updated: 9 November 2026. Latest confirmed development: Anthropic’s amended S-1, filed on 2 November, still leaves the share count and the IPO price range …
Claude Opus vs Sonnet

Claude Opus vs Sonnet: What the 2026 Price Gap Actually Buys

Last verified: 8 November 2026. All prices are Anthropic’s standard first-party API rates in US dollars per million tokens. They aren’t Claude Pro or Max …
RSA-1024

Did AI Break RSA? What DeepMind Actually Found

Last verified: 8 November 2026. Both papers are unreviewed working papers, and no outside group has reproduced the results yet. No, AI did not break …
Model Distillation

Model Distillation Explained: When AI Learning Becomes Extraction

Last verified: 7 November 2026. Government and company claims are attributed throughout. None has been tested in court. A support team trains a small, cheap …