Kimi K3.1 Pro Hardware Requirements: GPUs, Memory, Cost

Kimi K3.1 Pro hardware requirements

Last updated: 5 November 2026. Kimi K3.1 Pro’s official weights are now on Hugging Face, so we’ve confirmed the parameter count, expert layout, MXFP4 format and checkpoint size, replaced the K3 licence terms with the published K3.1 Pro licence, corrected the attention layout and added a section on downloading the weights safely.

Before anyone argues about which GPU to rent, a smaller question settles most of the argument: how many bytes have to sit in accelerator memory before the first token comes out? For Kimi K3.1 Pro hardware requirements, that number already exists, even though the model’s own weights don’t.

Moonshot AI launched Kimi K3.1 Pro on its API on 23 October and describes it as a post-trained version of Kimi K3. K3’s weights have been public since July, and they occupy 1.561 TB. Unless Moonshot changes the format when it publishes K3.1 Pro, that’s the floor: about 1.56 TB of weights before a single cached token, activation buffer or draft model.

A model name doesn’t give you a GPU count. Weight format, memory per accelerator, the engine’s reservation, context length and concurrency do. This guide works through each with the arithmetic shown, so you can swap in your own numbers.

Quick Answer
  • Weights released: Kimi K3.1 Pro’s official weights went live on Hugging Face at the start of November 2026, under the moonshotai organisation.
  • Model size: 2.8T total parameters with 104B active, shipped as a 1.56 TB MXFP4 checkpoint split across 96 files.
  • Memory needed: about 1.6 TB of GPU memory for the weights alone, before KV cache.
  • Minimum GPUs: eight 288 GB GPUs (B300, GB300 or MI355X) as a floor, 16 B200 or H200 cards, or 24 to 32 H100s. These are our estimates, since Moonshot publishes no minimum hardware.
  • Long context: the 1M-token window adds up to about 18 GB per request on our revised estimate.
  • Licence: the Kimi K3.1-Pro License is MIT-style, with extra conditions above $20M in revenue or 100M monthly users.
  • Download safely: use only the official moonshotai repository and verify the files before you load them.
Key Takeaways
  • The official weights are out: 2.8T total parameters, 104B active, 1.56 TB across 96 safetensors shards on Hugging Face.
  • Fake and repackaged Kimi K3.1 Pro uploads are likely to follow, so download only from the moonshotai organisation and verify model weights before you download.
  • “2.8 TB at 8-bit” is arithmetic for a file that doesn’t exist. The native release is already 4-bit, trained that way.
  • Eight 288 GB GPUs in one node are the floor. B200, H200 and H100 fleets need two or more nodes just to hold the weights.
  • Every request costs a fixed 0.2 to 0.4 GB of KDA state plus about 14 KB per token of FP8 MLA cache, so short requests aren’t as cheap as their length suggests and million-token contexts are cheaper than on dense models.
  • A single on-demand AWS node costs about $102,540 a month before redundancy, staff or storage.
  • Matching the $2/$10 API on a 20k-in, 2k-out workload takes roughly 13,000 input and 1,300 output tokens per second, sustained around the clock. Measure whether your hardware can do that before you sign anything.
  • The K3 licence isn’t MIT: model-as-a-service businesses above $20 million in total company revenue need a separate agreement.

Quick Navigation


What is confirmed about Kimi K3.1 Pro

With the weights released on Hugging Face, every core specification on this page now comes from Moonshot’s own model card and config.json rather than from Kimi K3.

SpecificationKimi K3.1 ProSource
Total parameters2.8TModel card
Active parameters per token104BModel card
Layers93 (1 dense)Model card
Attention layout69 KDA (linear attention) + 24 Gated DSA (sparse attention)Model card, config.json
Experts896, with 16 routed + 2 shared per tokenconfig.json
Hidden size / attention heads7168 / 96Model card
Weight formatMXFP4 weights, MXFP8 activations, quantization-aware trainingModel card
Context window1,048,576 tokensconfig.json
Vision encoderMoonViT-V2, 401M parametersModel card
Checkpoint size1.56 TB, 96 safetensors shardsHugging Face file tree
Recommended enginesvLLM, SGLang, TokenSpeedModel card
APILive as kimi-k3.1-proKimi blog

One change from Kimi K3 matters for memory planning. K3.1 Pro swaps K3’s 24 full-attention Gated MLA layers for Gated DSA, a sparse attention design, which changes the KV cache figures below. Moonshot doesn’t state minimum hardware anywhere in the release, so the GPU counts on this page remain our estimates from the published sizes.

Calculating Kimi K3.1 Pro weight memory
Kimi K3.1 Pro hardware requirements

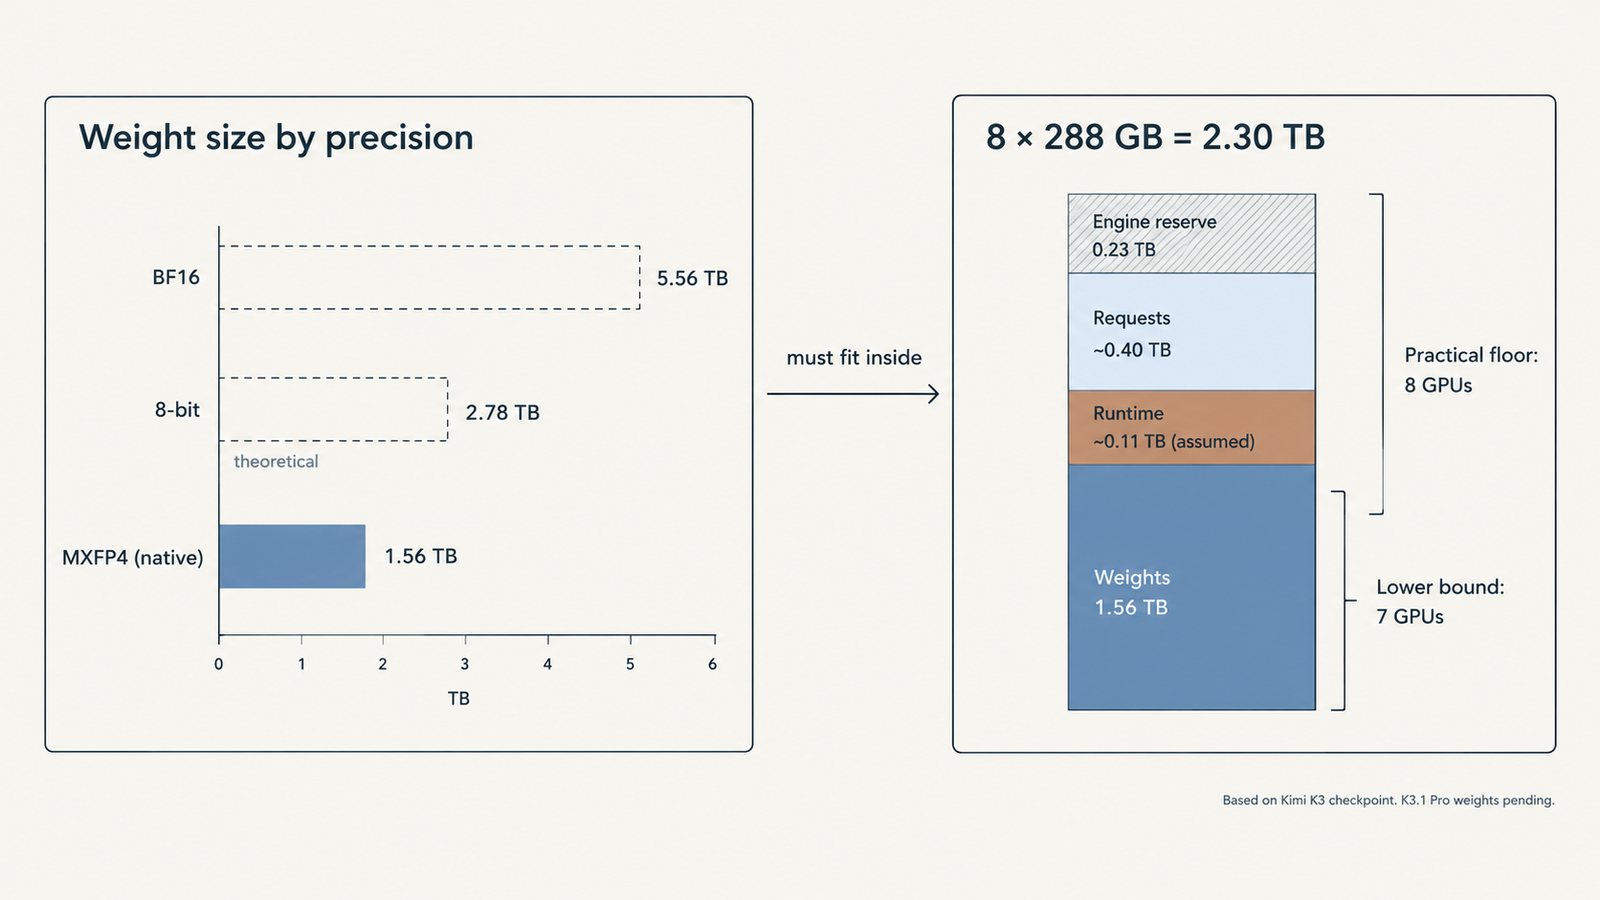
The formula is plain: weight bytes = parameters x bits per parameter ÷ 8. Using K3’s 2,779,931,837,184 parameters:

PrecisionBits per parameterDecimal TBBinary TiBWhat it represents
BF16165.5605.057Theoretical; no such release
8-bit (FP8/INT8)82.7802.528Theoretical
4-bit, no scales41.3901.264Theoretical minimum
MXFP4 everywhere4.251.4771.343Adds one 8-bit scale per 32 weights
Actual K3 checkpoint4.49 (effective)1.5611.420Published repository, 96 shards

The released checkpoint confirms the MXFP4 estimate. Moonshot’s config lists the format as mxfp4-pack-quantized with one scale per group of 32 weights, and the Hugging Face repository totals 1.56 TB across 96 shards. Plan for about 1.6 TB of memory for weights, plus room for the vision encoder, KV cache and runtime overhead.

All rows are weights only, with no runtime overhead. The brief’s “2.8 TB at 8-bit, 1.4 TB at 4-bit” is correct arithmetic for the wrong question. Moonshot trained K3 to run in MXFP4 from supervised fine-tuning onward, so there is no 8-bit release to plan around.

The gap between 1.39 TB and 1.561 TB has two sources. MXFP4 stores a shared 8-bit scale for every block of 32 weights, adding about 0.09 TB. And the config leaves attention, shared experts, the dense first-layer MLP, the output head and the vision encoder unquantized. The “5.6 TB” figures circulating for K3 come from assuming BF16.

Watch your units. TB is 10^12 bytes and TiB is 2^40, about 10% larger. NVIDIA lists a DGX B300’s total GPU memory as “2.1 TB”, yet eight 288 GB GPUs hold 2,304 GB, which is 2.10 TiB. Compare a TiB capacity with a TB weight file and you’ve lost a tenth of your headroom on paper.

How many GPUs Kimi K3.1 Pro needs

The lower bound is: GPUs = ceiling(weight bytes ÷ (memory per GPU x usable fraction)). vLLM’s Kimi K3 recipes run at 0.88 to 0.92 of GPU memory; this guide uses 0.90.

AcceleratorMemory per GPULower boundPractical layoutFits one 8-GPU node?
NVIDIA B300 / GB300288 GB78Yes, ~513 GB left after weights
AMD MI355X288 GB78Yes, same arithmetic
NVIDIA B200180 GB1016 (two nodes)No: 1,440 GB total
NVIDIA H200141 GB1316 (two nodes)No: 1,128 GB total
NVIDIA H10080 GB2224 to 32 (three to four nodes)No

Memory per GPU from AMD’s MI355X page (which also lists B200 at 180 GB) and NVIDIA. Seven 288 GB GPUs clear the bound, but tensor parallelism splits the 96 attention heads across GPUs, and 96 doesn’t divide by seven. Eight is the real floor, and it’s what the vLLM recipe states: at least 8x GB300, or 8x MI355X/MI350X on ROCm, with “multi-node for real production traffic”.

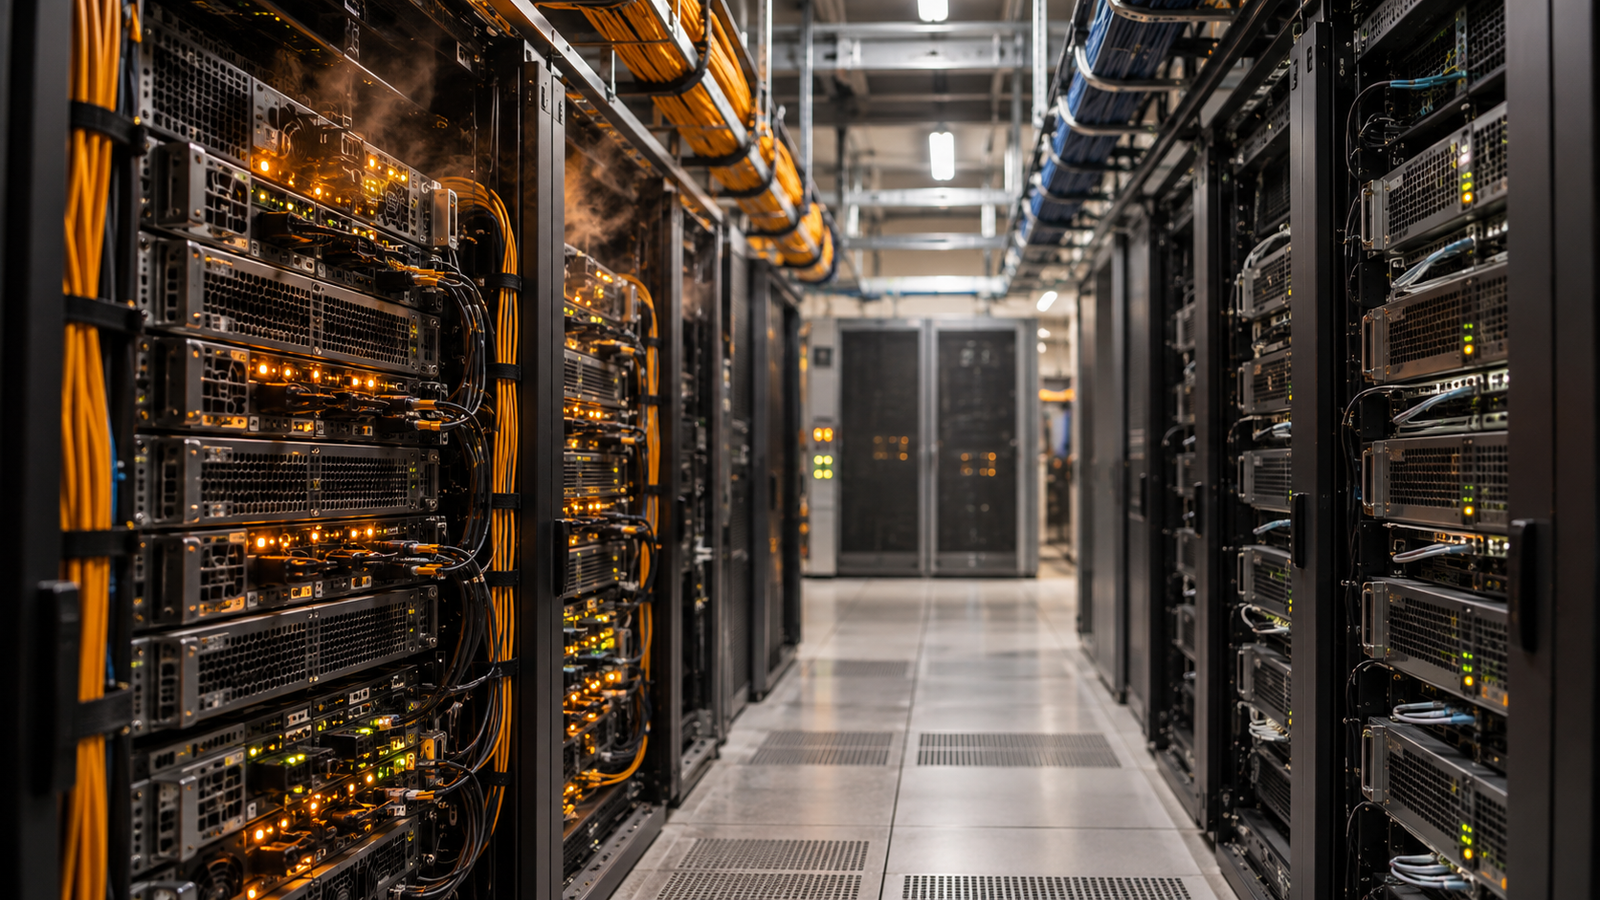
Eight GPUs are not one 2.3 TB pool. Each holds its own shard, and every layer exchanges activations between them. Inside a DGX B300 that traffic rides NVLink at 14.4 TB/s aggregate. Between nodes it crosses InfiniBand or Ethernet at up to 800 Gb/s per port, roughly 100 GB/s, which is why two-node recipes split the model into pipeline stages (TP8 x PP2) and why NVIDIA’s Dynamo recipes target GB200 and GB300 racks with NVLink spanning trays: 16 GB200s aggregated, or 32 split between prefill and decode.

Hopper is the awkward case. H100 and H200 lack native FP4 tensor cores, so MXFP4 experts run through dequantising kernels. The recipe page builds commands for H200, but its stated minimum is Blackwell or MI355X, and we found no published throughput for K3 on Hopper.

Can a single GPU or workstation run it?

No single GPU comes close. The workstation route is llama.cpp with the experts in system RAM. One published test loaded a ~554 GB 1-bit GGUF of K3 on a 160 GB VRAM machine with the MoE weights on CPU. Nobody has published quality figures for that quant. The 4-bit GGUF is 1,508.7 GB, barely smaller than the native file, because the native file is already 4-bit. It’s a way to poke at the model, not to serve users, and Now that the weights are public, community quants of Kimi K3.1 Pro can appear, but none are official, and their quality and memory use are unverified until someone tests them. The K3 result above (a 554 GB 1-bit GGUF reportedly running on 160 GB of VRAM) is the best guide for now. Before you run any community build, put it through the checks in our model weights verification guide..

The KV cache changes the Kimi K3.1 Pro calculation

This is the one part of the page where the release changed our numbers. Our first estimate assumed K3’s Gated MLA layers. Kimi K3.1 Pro uses Gated DSA in those 24 layers instead, and its config gives the inputs for a revised estimate.

  • DSA layers: the config keeps a 512-value compressed KV latent plus a 64-value positional key (576 values), and adds a lightning indexer with a 128-dimension key. Assuming each of the 24 layers caches both, as DeepSeek’s DSA does, that’s 24 × (576 + 128) = 16,896 values per token, or about 16.9 KB at FP8.
  • KDA layers: these keep a fixed-size state rather than a growing cache. At 69 layers × 96 heads × 128 × 128 values in BF16, that’s about 0.22 GB per request, whatever the context length.
Context lengthDSA cache (FP8)KDA stateTotal per request (estimate)
8K tokens0.14 GB0.22 GB0.36 GB
32K tokens0.55 GB0.22 GB0.77 GB
128K tokens2.21 GB0.22 GB2.43 GB
256K tokens4.43 GB0.22 GB4.65 GB
1M tokens17.72 GB0.22 GB17.93 GB

Treat these as planning estimates, not measured figures. Moonshot hasn’t published KV cache sizes, and vLLM or SGLang may store the cache differently. The indexer only picks the top 2,048 earlier tokens for each query (index_topk in the config), which saves compute, but the full cache still has to sit in memory. Check your engine’s own memory report once the model loads.

Two things fall out. Below about 16,000 tokens the fixed state outweighs the growing cache, so short chat traffic carries a per-request floor most sizing guides ignore. At the other end, long contexts are cheap: a 70B dense model with grouped-query attention needs about 160 KB per token, as our breakdown of AI memory costs works out, or roughly 172 GB for a million tokens against K3’s 14.7 GB.

On one 8x B300 node, 0.90 of 2,304 GB leaves about 2,074 GB, and weights take 1,561 GB. Set aside an assumed 110 GB for activations, CUDA graphs, communication buffers and the speculative draft model the recipes load, and roughly 400 GB remains for requests. That’s an upper bound of about 600 concurrent requests at 32K, 197 at 128K, or 27 at the full million.

Those counts assume the cache is spread across GPUs without duplication. vLLM’s decode context parallelism does that for MLA; without it, tensor-parallel ranks can each hold a copy and the numbers fall sharply. The recipes also spill to host RAM: one AMD prefill configuration budgets 1,799 GB of host DRAM for cache offload. Memory scales linearly with concurrency and context. Throughput at those concurrencies is a separate question that only measurement answers.

Where to download Kimi K3.1 Pro weights safely

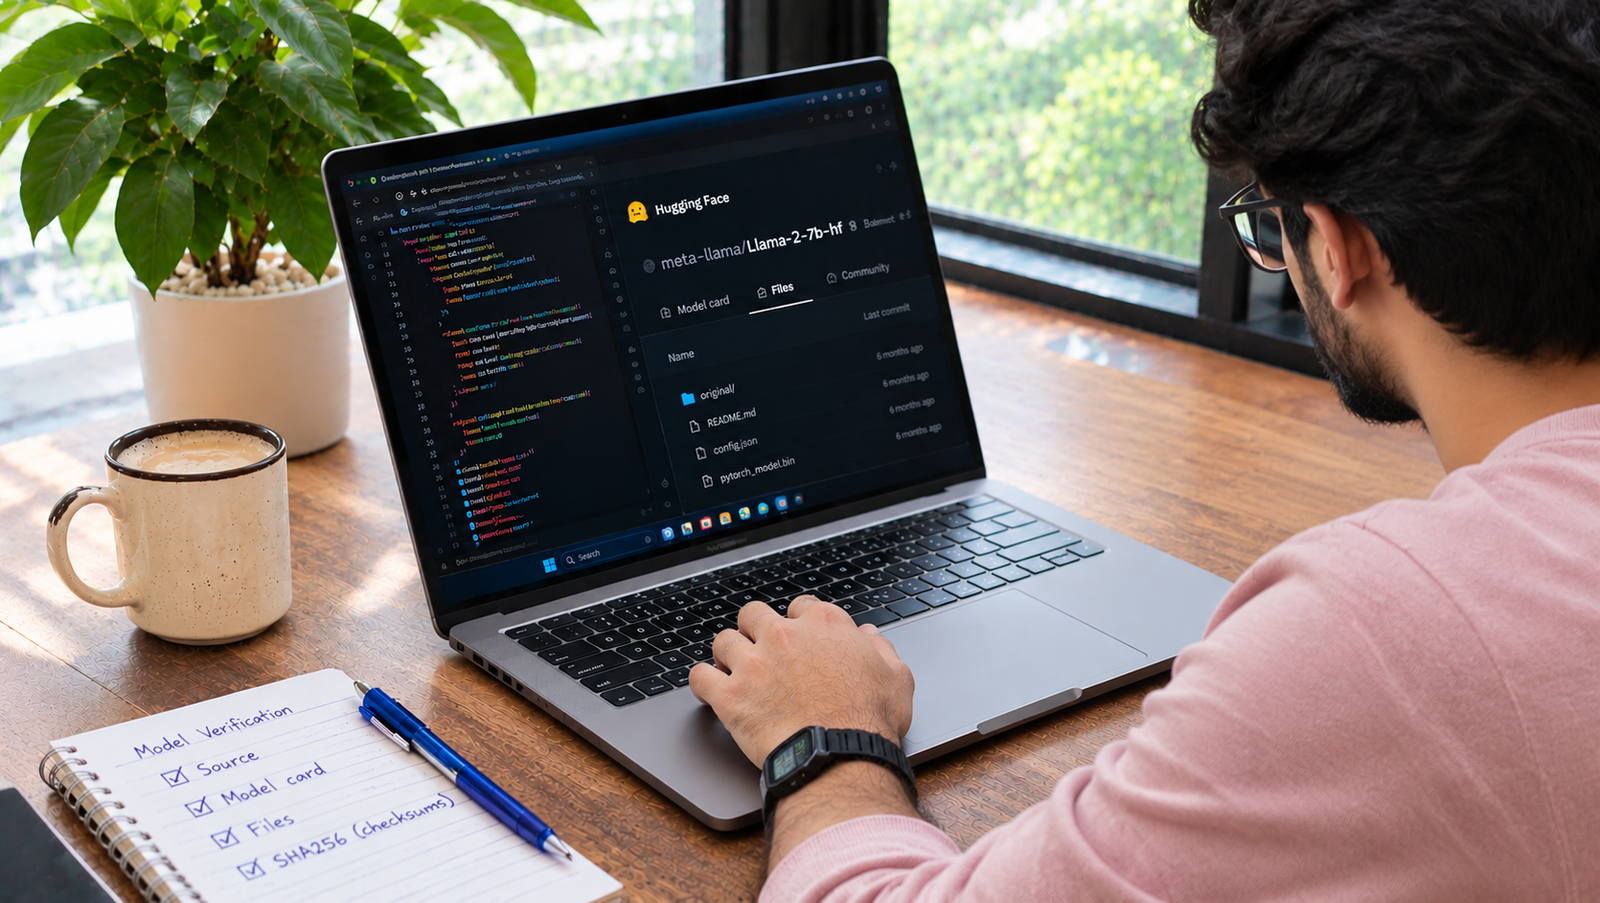
The only official source is the moonshotai/Kimi-K3.1-Pro repository on Hugging Face. A 1.56 TB download is a big target for copycats, and a fake or tampered upload costs you days of transfer time and GPU hours before you notice anything is wrong.

There’s a second reason to be careful with this release. The repository ships its own Python files, and Moonshot’s usage example loads them with trust_remote_code=True. A mirror that changes those files can run code on your servers the moment you load the model. Our guide to spotting fake model weights walks through seven checks before you download. For Kimi K3.1 Pro, the short version is:

  1. Check the organisation. The repo should sit under moonshotai, the same Hugging Face account that hosts Moonshot’s earlier Kimi K3 release.
  2. Check the file list. Expect 96 safetensors shards totalling about 1.56 TB, plus config.json, the LICENSE and the custom code files. Pickle or .bin weight files are a warning sign.
  3. Read the custom code before you trust it. If you pull from anywhere other than the official repo, compare the .py files against Moonshot’s versions line by line.
  4. Compare hashes. Hugging Face shows a SHA-256 for each large file. Match your local copies against the official repo, not against the mirror you downloaded from.
  5. Treat quants as third-party software. Moonshot hasn’t released any official quantised variants. Any GGUF or lower-bit build is a community conversion, so check who made it and what it was built from.

Quantisation trade-offs

Weight quantisation and cache quantisation are separate levers, and the first one is mostly pulled already.

LeverMemory effectWhat you risk
Keep native MXFP4 weightsBaseline 1.561 TBNothing; this is how the model was trained
Up-cast to FP8 or BF161.8x to 3.6x moreHardware cost, with no documented quality gain
Community 1-bit or 2-bit quantsAbout 0.55 TB for the smallest published 1-bit GGUFUnmeasured quality loss; K3-only until K3.1 Pro weights ship
FP8 KV cacheHalves the MLA cache versus BF16Small accuracy risk; recipes use it by default
FP32 vs BF16 KDA stateDoubles or halves the fixed per-request stateSome low-latency backends require FP32

Because K3 went through quantization-aware training, its 4-bit weights aren’t a lossy copy of some better original that’s available to you. Going below 4 bits is a real compression, and nobody has published K3 or K3.1 Pro quality numbers for those quants. Run your own evaluation against the hosted API before trusting one.

Hardware matters here too. Blackwell and AMD’s CDNA 4 parts execute MXFP4 natively; AMD lists 10.1 PFLOPs of MXFP4 matrix throughput for the MI355X. Hopper doesn’t, which is a second reason the recipes start at Blackwell. The cache side has its own knobs: the latency-tuned GB300 profile switches the KDA state to FP32, doubling that per-request floor to about 0.43 GB.

The real cost of self-hosting Kimi K3.1 Pro
Kimi K3.1 Pro hardware requirements

Two dated price points for one 8x B300 node, on demand, 30 days at 24 hours:

ItemAWS p6-b300.48xlargeMedian specialist cloud
Hourly, 8x B300$142.42$65.44 ($8.18 per GPU)
30 days continuous (720 h)$102,540$47,117
Effective rate at 50% useful utilisation$284.83/h$130.88/h
Effective rate at 25% useful utilisation$569.66/h$261.76/h

AWS rate: us-east-1, Linux, on demand, per Vantage’s EC2 tracker, read 26 October 2026; the instance includes 4,096 GiB of host RAM and 8 x 3.84 TB local NVMe. Specialist rate: median across 10 providers per getdeploying, 8 September 2026; those offers may not match AWS on networking, storage or availability.

The effective-rate rows are the ones that matter. A node you pay for around the clock but keep busy half the time costs twice as much per useful hour, and real traffic has nights and weekends.

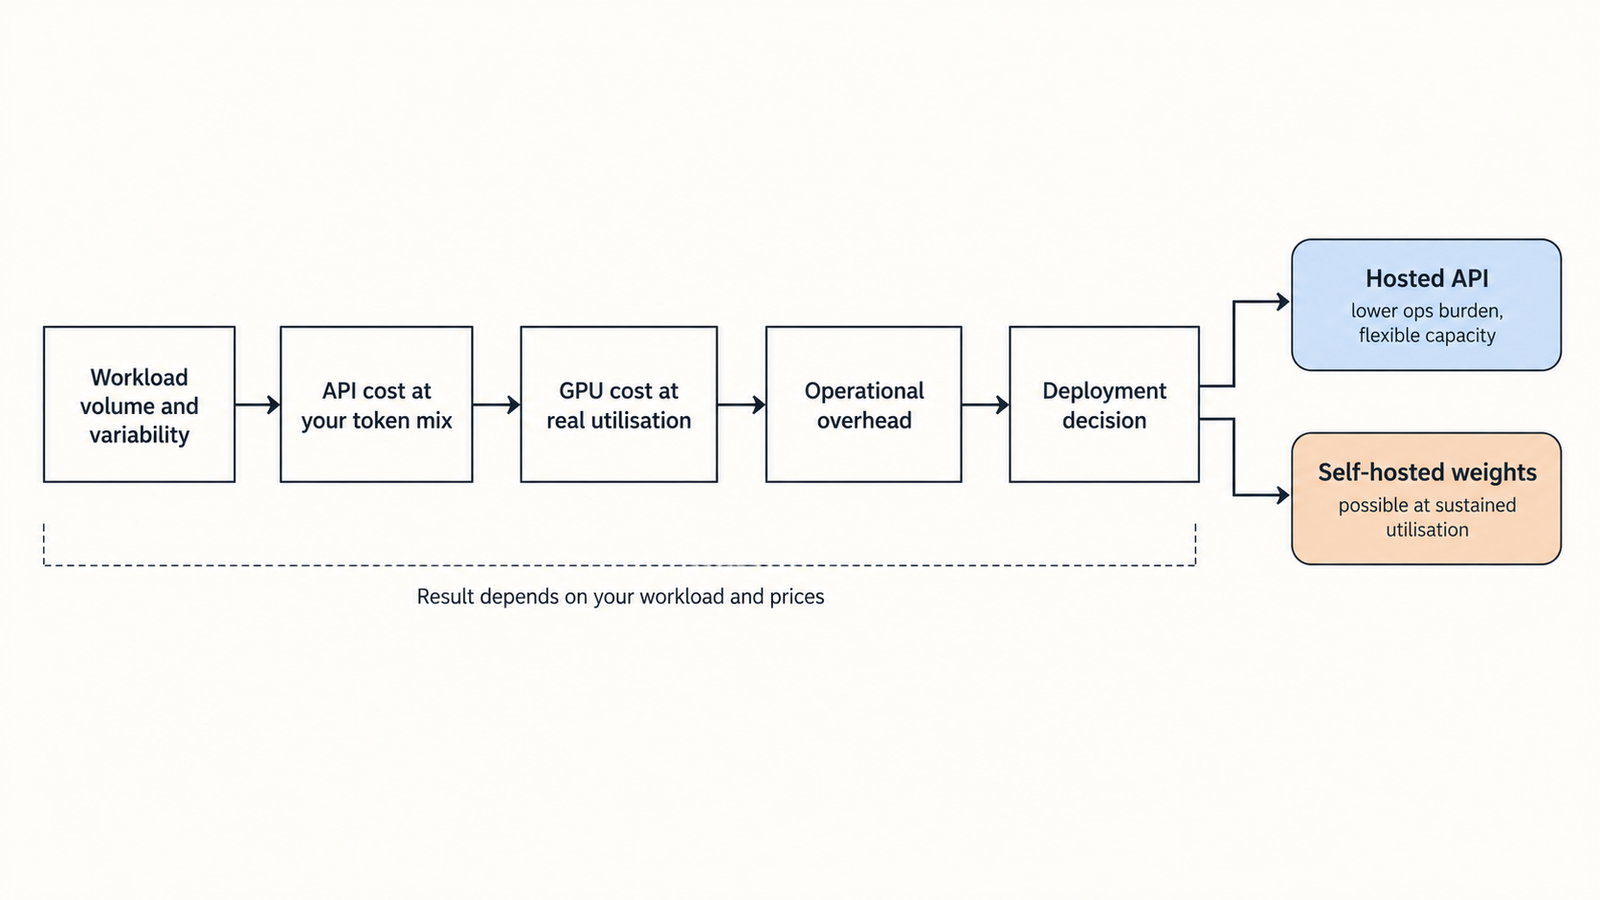
The GPU line also isn’t the bill. One node has no redundancy, so a production service needs a second, doubling the fixed cost before it serves an extra token. Add engineering time, monitoring, storage for 1.56 TB of weights plus staging on every node, egress, and the work of swapping in K3.1 Pro weights when they arrive. Published estimates of that total put it at 1.3 to 5 times the raw GPU rate, a range we unpack in the hidden fees in self-hosted LLM cost.

Kimi K3.1 Pro API vs self-hosting: the break-even

Moonshot’s API price for standard kimi-k3.1-pro is $2 per million input tokens, $10 per million output and $0.20 per million cached input, confirmed by Artificial Analysis. The Highspeed variant costs $4/$20. Cache writes are billed separately at a rate that wasn’t displayed when we checked.

The formula: API cost = (input tokens ÷ 1,000,000 x input rate) + (output tokens ÷ 1,000,000 x output rate).

Illustrative workload, an assumption: an agentic coding call with 20,000 input tokens and 2,000 output tokens, reasoning included. Uncached, that’s $0.04 + $0.02 = $0.06 per call. With 90% of input served from cache, it’s $0.0076 + $0.02 = $0.0276, before cache-write fees.

Break-even calls per month = monthly self-hosting cost ÷ API cost per call. Spread over 2,592,000 seconds in 30 days:

Scenario (GPU cost only)Calls/month to match APISustained calls/sInput tokens/sOutput tokens/s
AWS, no cache1.71M0.6613,1871,319
AWS, 90% cache hits3.72M1.4328,6672,867
Specialist cloud, no cache785K0.306,059606
Specialist cloud, 90% cache hits1.71M0.6613,1721,317

Caching makes the API cheaper, so it pushes break-even further away. And these are averages held for 720 hours straight. Peaks need headroom above them, so a fleet that just breaks even on average is running below capacity most of the day.

Can one node sustain those rates at an acceptable latency? There’s no independent published throughput for K3.1 Pro on 8x B300, so that’s the number to measure, not assume. Remember too that the right comparison is the cheapest API that meets your quality bar. Third-party hosts listed K3 below Moonshot’s own price on OpenRouter, and the same is likely once K3.1 Pro weights circulate. Our Kimi K3.1 Pro vs Sonnet 5.5 comparison covers per-task token use, which moves the API side of this equation more than the rate card does.

Self-hosting earns its place when data can’t leave your infrastructure, when load is high and steady enough to keep a node busy, when you need to fine-tune, or when you already own Blackwell capacity sitting idle.

Licence and operational constraints

Moonshot published the Kimi K3.1-Pro License with the weights. It starts as an MIT-style licence, then adds three conditions that matter for self-hosting.

  • Model-as-a-Service: if you sell access to the model and earn more than $20M in aggregate revenue over any consecutive 12 months, you need a separate agreement with Moonshot.
  • Attribution: a product with more than 100 million monthly active users, or more than $20M in monthly revenue, must prominently display “Kimi K3.1-Pro”.
  • Exemptions: internal use is exempt, as is use through Moonshot’s official products or certified inference partners.

For most teams running the model in-house, the licence won’t change the hardware decision. If you plan to resell inference at scale, email license@moonshot.ai before you buy GPUs. This is a summary, not legal advice, so have your counsel read the full text.

A practical Kimi K3.1 Pro deployment decision

  • Use the hosted API when traffic is small, spiky or unproven, or nobody on the team runs GPU clusters. Moonshot offers zero data retention to API customers, which settles some privacy objections without any hardware.
  • Rent one 8x B300 or MI355X node for evaluations, fine-tuning experiments or steady internal batch work you can keep busy. Accept that it has no redundancy.
  • Plan multi-node or rack-scale for production with latency targets, long contexts at high concurrency, or uptime commitments. Moonshot’s 64-plus accelerator guidance describes this tier.
  • Benchmark before you sign. Replay 50 to 200 real requests, measure tokens per second at your p95 latency target, and compare any quantised variant’s outputs with the hosted API.

What would change this estimate? The K3.1 Pro file size and precision; the KDA state dtype your engine uses; your measured throughput per node; GPU rental prices, which roughly doubled for B300 through 2026 according to price trackers; and the K3.1 Pro licence terms.

Conclusion

Kimi K3.1 Pro’s weights are now public, and they match the estimates this page made before launch: a 1.56 TB MXFP4 checkpoint that needs about 1.6 TB of GPU memory before KV cache. Eight 288 GB GPUs remain the practical floor, and the 1M-token context adds up to about 18 GB per request on our revised estimate. For most teams the API is still the cheaper route unless usage is heavy and steady. If you do self-host, start from the official moonshotai repository and verify the files before anything touches your cluster.

So don’t rent for Kimi K3.1 Pro hardware requirements yet. Use the API, log your real token mix and concurrency, and when the weights land, check the file size against 1.56 TB, then spend a week on one rented node measuring tokens per second at your latency target. If that number can’t clear the break-even rates in the table above with room for peaks and a second replica, the API was the cheaper machine all along.

Frequently asked questions

How much VRAM does Kimi K3.1 Pro need?

About 1.6 TB for the weights alone, based on the official 1.56 TB MXFP4 checkpoint, plus KV cache and overhead. That’s eight 288 GB GPUs at minimum, 16 B200 or H200 cards, or 24 to 32 H100s. Moonshot doesn’t publish minimum hardware, so these counts are our estimates.

Can Kimi K3.1 Pro run on one GPU?

No. The largest current accelerators, NVIDIA B300 and AMD MI355X, hold 288 GB each, under a fifth of the 1.56 TB weight file. Even heavily compressed community quants of K3 run to roughly 550 GB, which still needs several GPUs or large amounts of system RAM.

How many GPUs are needed for a model of this size?

Eight 288 GB GPUs are the practical minimum and match the vLLM recipe’s stated floor. With 180 GB B200s or 141 GB H200s you need 16 across two nodes. Moonshot recommends 64 or more accelerators for efficient production serving.

Does 4-bit quantisation reduce memory requirements?

For this model it’s already applied. Kimi K3 ships in MXFP4, a 4-bit format with shared scales, trained that way from fine-tuning onward. Converting to 8-bit would roughly double memory. Going below 4 bits shrinks the file further, but no published quality data exists for those quants.

How much does self-hosting cost per month?

One 8x B300 node costs about $102,540 for 30 days on AWS on demand, or about $47,117 at the median specialist-cloud rate (prices checked September to October 2026). Redundancy, staff, storage and idle time add substantially to that GPU line.

Is an API cheaper than running the model locally?

For most workloads, yes. At $2/$10 per million tokens, a self-hosted AWS node only matches the API if it sustains about 1.7 million 20k-token calls a month. Self-hosting can win on data control, steady high load or fine-tuning needs.

Can I run Kimi K3.1 Pro on a workstation?

Not at the official precision. The checkpoint is far larger than any workstation’s memory. Community quants may make heavily compressed versions possible, as a 1-bit GGUF did for Kimi K3, but none are official and quality is untested.

What licence applies to commercial deployment?

The Kimi K3.1-Pro License, an MIT-style licence with extra conditions. Model-as-a-Service businesses earning over $20M in 12 months need a separate agreement, and products above 100M monthly users or $20M monthly revenue must display “Kimi K3.1-Pro”. Internal use is exempt.

Where can I download Kimi K3.1 Pro safely?

Only from the official moonshotai/Kimi-K3.1-Pro repository on Hugging Face. Check the organisation, file list and hashes before downloading, and see our guide to verifying model weights for the full checklist.


Keep reading

AGI vs superintelligence

AGI vs Superintelligence: A New Name Isn’t a New Intelligence

Facts checked against official documents and reporting on 18 November 2026. On 29 September, the White House told federal agencies to stop writing “artificial intelligence” …
AI Coding Agent

AI Coding Agents Are Getting Expensive. Who’s Paying for the Tokens?
Pricing checked on official vendor pages on 17 November 2026. All USD. Cost scenarios are illustrative and labelled as such. On 28 October, TechCrunch published …
Model Weights

Verify Model Weights: 7 Checks Before You Download
Checked against the burner22/numbat repository and its discussions, Hugging Face and PyTorch documentation, and Moonshot AI’s announcement on 2 November 2026. On 1 November, a …
Agentic AI Statistics

30 Agentic AI Statistics for 2026: Adoption, Spending and Risk

Last updated: 15 November 2026. This page is updated monthly; each figure keeps its original publication date. Agent traffic at one healthcare booking platform rose …

Accelerator Utilisation: The Number That Decides Your Bill

Accelerator Utilisation

An accelerator bills the same whether it is generating tokens or waiting for a database query to return. The hardware cost is fixed the moment you provision it. The useful work is not.

That asymmetry is the whole subject. Every hour an accelerator spends idle, stalled or doing work that produces no billable output still has to be paid for, and the only place that cost can go is into the price of the tokens the fleet does produce. Accelerator utilisation is therefore not a monitoring metric that sits beside cost. It is a term in the cost equation.

What makes it difficult is that the number most teams watch — the utilisation percentage on the dashboard — answers a narrower question than they think, and the gap between a busy accelerator and a productive one is where inference budgets quietly go.

Key takeaways
  • The standard GPU utilisation figure measures the fraction of time at least one kernel was executing. It says nothing about how much of the chip that kernel used, which is why a memory-bound decode step can read 100% while running at a small fraction of peak throughput.
  • Prefill and decode stress different parts of the hardware, and mixing them on one pool means one phase interferes with the other. Long prefills stall active decode streams, which is why chunked prefill and disaggregation exist.
  • Some idle capacity is deliberate. Queueing delay rises sharply as a system approaches saturation, so latency-sensitive services must hold headroom to protect p95 and p99. A fleet at 60% may be correctly sized and one at 95% may be missing its SLA.
  • Agentic workloads break the batching assumption. Between model calls an agent waits on tools, APIs and networks, producing request-level gaps that conventional high-volume batching handles poorly.
  • Continuous batching recovers scheduling gaps, disaggregation recovers phase interference, and capacity pooling recovers demand variance. They address different losses and are not substitutes.
  • Cost per accelerator-hour is not cost per useful token. The same hour, at different achieved throughput, produces order-of-magnitude differences in effective cost.

Quick Navigation


The Accelerator Utilisation Number Most Teams Read Incorrectly

Accelerator utilisation, as commonly reported, measures the percentage of time over a sampling period during which one or more kernels were executing on the device. NVIDIA’s own definition is a duty cycle. It is a measure of when, not of how much.

That distinction matters more than it sounds. A kernel occupying a single streaming multiprocessor for the entire sampling window reports the same figure as one saturating every SM on the chip. The metric cannot tell them apart, because it was never designed to.

Five quantities get conflated under the word utilisation, and separating them is the first practical step:

TermWhat it means
Theoretical capacityWhat the hardware could produce at peak — FLOPS, memory bandwidth, the specification numbers
Allocated capacityWhat has been assigned or reserved to a workload, whether or not it is being used
Instantaneous utilisationThe duty-cycle percentage on the dashboard right now
Achieved throughputTokens or requests actually produced per second
Economically useful utilisationThe share of accelerator-time that produced output someone is paying for

The last row is the one that appears on the invoice and on no dashboard by default.

Deeper counters help. DCGM exposes SM activity, SM occupancy and Tensor Core pipe activity alongside the basic figure, and research comparing them has shown that the coarse utilisation metric and SM-level activity do not always agree. Tensor Core activity in particular sits closest to the work that produces model output for matrix-heavy inference.

Even those are counters rather than verdicts. A kernel running at a small fraction of peak FLOPS for 100 milliseconds still scores fully on SM activity for that interval.


Why an Accelerator Can Be Busy Without Being Efficient

There are several ways to post an impressive utilisation figure while producing very little.

  • Memory-bandwidth saturation. A kernel streaming more data than the compute units can consume keeps the SMs occupied while the arithmetic sits idle waiting on HBM. This is the normal state of autoregressive decoding, not an exotic failure. We worked through the memory side of this in our breakdown of what AI memory actually costs, and the short version is that bandwidth, not FLOPS, sets the ceiling for token generation.
  • Small batches. A batch of one keeps the device busy and wastes most of its parallelism. The weights must be read from memory for every forward pass regardless of how many sequences ride along, so a batch of one pays the full memory cost for a single token.
  • Padding. Batching sequences of unequal length means computing over padding tokens that produce nothing.
  • Speculative work that gets discarded. Rejected draft tokens in speculative decoding consumed real cycles.
  • Communication and synchronisation. In multi-GPU serving, time spent in collectives or waiting on a peer is time the accelerator is occupied and unproductive.

The common thread: the duty-cycle metric counts occupancy, and occupancy is not output. The question worth asking of any inference fleet is not how busy the accelerators are but how many useful tokens each accelerator-hour produced.


Prefill and Decode Pull Accelerator Utilisation in Two Directions

LLM inference runs in two phases with different hardware appetites.

  • Prefill processes the input prompt. Every token is available at once, so attention and the feed-forward layers run as large dense matrix multiplications across the whole sequence. This is highly parallel work that can keep arithmetic units genuinely busy.
  • Decode generates output tokens one at a time. Each step depends on the previous one, so the parallelism across the sequence disappears. The step reads the model weights and the accumulated KV cache to produce a single token per sequence.

The usual shorthand is that prefill is compute-bound and decode is memory-bound. It is a good first approximation and a poor absolute rule.

Where it breaks down: a very short prompt does not saturate compute during prefill. A large enough decode batch, with many sequences advancing together, reaches arithmetic intensity high enough that compute matters again. Mixture-of-experts routing changes the picture further, and quantisation shifts where the bottleneck falls. The phases have tendencies, and the tendencies are strong enough to design around, but a specific workload on specific hardware can sit anywhere along the spectrum.

What is reliably true is that the two phases interfere when they share a device. A long prefill occupies the accelerator for a substantial block of time, and every decode stream already in flight stalls while it runs. The user sees it as a pause mid-generation — inter-token latency spiking for reasons unrelated to their own request.

The standard mitigation is chunked prefill: split a long prompt into chunks, commonly 512 tokens, and interleave them with decode iterations. Larger chunks mean fewer but longer stalls; smaller chunks mean more but shorter ones. NVIDIA’s tuning documentation for disaggregated serving describes exactly this trade-off, noting that the maximum token setting controls the longest prefill that can be piggybacked onto decode and therefore controls inter-token latency.

This is why a fleet can show healthy utilisation and still fail its latency targets. The accelerators are busy. They are busy doing prefill work that is delaying token generation for everyone else on the device.


Traffic Peaks Are the Hidden Accelerator Utilisation Tax

Demand for an inference service is almost never flat. It moves with the working day, with time zones, with weekdays against weekends, with product launches and marketing campaigns, and with whatever a large customer decided to run this morning.

Accelerator capacity does not move with it. You provision a number of devices, and that number is the same at 3am as at 3pm.

The consequence is arithmetic rather than engineering. A fleet sized for peak has unused capacity at every other hour, and the ratio between peak and trough sets a ceiling on average utilisation that no amount of serving optimisation can lift. If peak traffic is three times the trough and you must serve peak, average utilisation over the day cannot approach 100% no matter how good the scheduler is.

Capacity headroom is the deliberate gap between provisioned capacity and expected load. It exists for two reasons: to absorb traffic above forecast, and to keep queueing delay within bounds.

The options for handling variance each carry a different cost:

ApproachWhat it costs
Size for peakIdle capacity at every non-peak hour
Size for averageSLA violations during spikes
AutoscaleCold starts, model loading time, and capacity that may not be available on demand
Pool with flexible workloadsComplexity and isolation concerns

Model loading deserves a note, because it is what makes inference autoscaling harder than web autoscaling. Bringing a new accelerator into service means loading tens or hundreds of gigabytes of weights before it can serve a single token. That delay sits between the spike and the response to it.


The Latency SLA That Looks Like Waste

Queueing theory gives the uncomfortable result that makes low utilisation rational.

As a system’s arrival rate approaches its service capacity, queue length and waiting time do not rise linearly. They rise sharply, and near saturation they rise without bound. The practical version: a system running at 70% of capacity has modest queueing delay, and the same system at 95% has delay that dominates the response time entirely.

For a latency-sensitive inference service, that shape sets a hard limit on how high utilisation can go. If your contract or your product requires a p99 time-to-first-token under some threshold, you cannot run the fleet near saturation, because the tail is precisely what breaks first.

This reframes what a dashboard is showing you. Idle capacity on a latency-sensitive service is not necessarily waste. It is the buffer that keeps p95 and p99 within bounds, and removing it converts an accelerator-cost saving into an SLA breach.

A fleet at 95% utilisation is not automatically healthier than one at 60%. The 60% system may be correctly sized for its tail-latency commitment; the 95% system may be quietly missing it. Neither number means anything without the latency distribution beside it.

The corollary is worth stating plainly: utilisation targets should differ by workload class. Batch scoring, overnight document processing and offline evaluation can and should run close to saturation, because nobody is waiting. Interactive serving cannot. Treating both with one utilisation target guarantees you are either wasting money on the batch fleet or breaking the interactive one.


Why Agents Create Empty Accelerator Time

A conventional inference request arrives, gets served and leaves. An agent request does something else.

A typical agent turn looks like this:

  1. Call the model to decide what to do
  2. Wait for a tool — a search, a database query, an API call
  3. Receive the result
  4. Call the model again with the result in context
  5. Wait for another service
  6. Call the model once more to produce the answer

Steps 2 and 5 are the problem. During those waits, that request needs no accelerator time at all, but it holds state: its KV cache is either kept resident, occupying memory that could serve another request, or evicted and recomputed later at compute cost.

The waits are not short. A database query takes tens of milliseconds, an external API call hundreds, a web search or a code-execution sandbox longer still. Set against a decode step measured in single-digit milliseconds, a single tool call can be worth hundreds of decode iterations.

Three properties make agent traffic harder to batch than conventional inference:

  1. Arrival patterns are bursty and correlated. Many agents hitting step 4 at the same moment creates a spike; the tool waits between steps create troughs. The load is lumpy at exactly the timescale batching operates on.
  2. Context grows through the turn. Each step carries the accumulated transcript, so prefill cost rises with every iteration. Late steps in a long agent turn are expensive to re-prefill and expensive to keep cached.
  3. Step counts vary wildly. One task finishes in two model calls, another takes twenty. Capacity planning against an average here is planning against a number that describes almost none of the traffic.

None of this means agent workloads necessarily run at poor utilisation. A service with enough concurrent agents can fill the gaps from one agent’s tool wait with another agent’s model call, and prefix caching substantially reduces the cost of re-sending a growing transcript. The difficulty is concentration: a handful of high-value agents produces far worse utilisation than thousands of chat users generating the same token volume, because there is nothing to interleave.

The practical implication is that agent platforms should measure accelerator utilisation against model-call time, not against wall-clock request duration. A request that takes 40 seconds and uses four seconds of accelerator time is not a utilisation failure. Counting it as one leads teams to optimise the wrong layer.


Three Ways to Recover Accelerator Utilisation

Each mechanism addresses a different loss. Applying one to a problem caused by another wastes engineering time and changes nothing on the invoice.

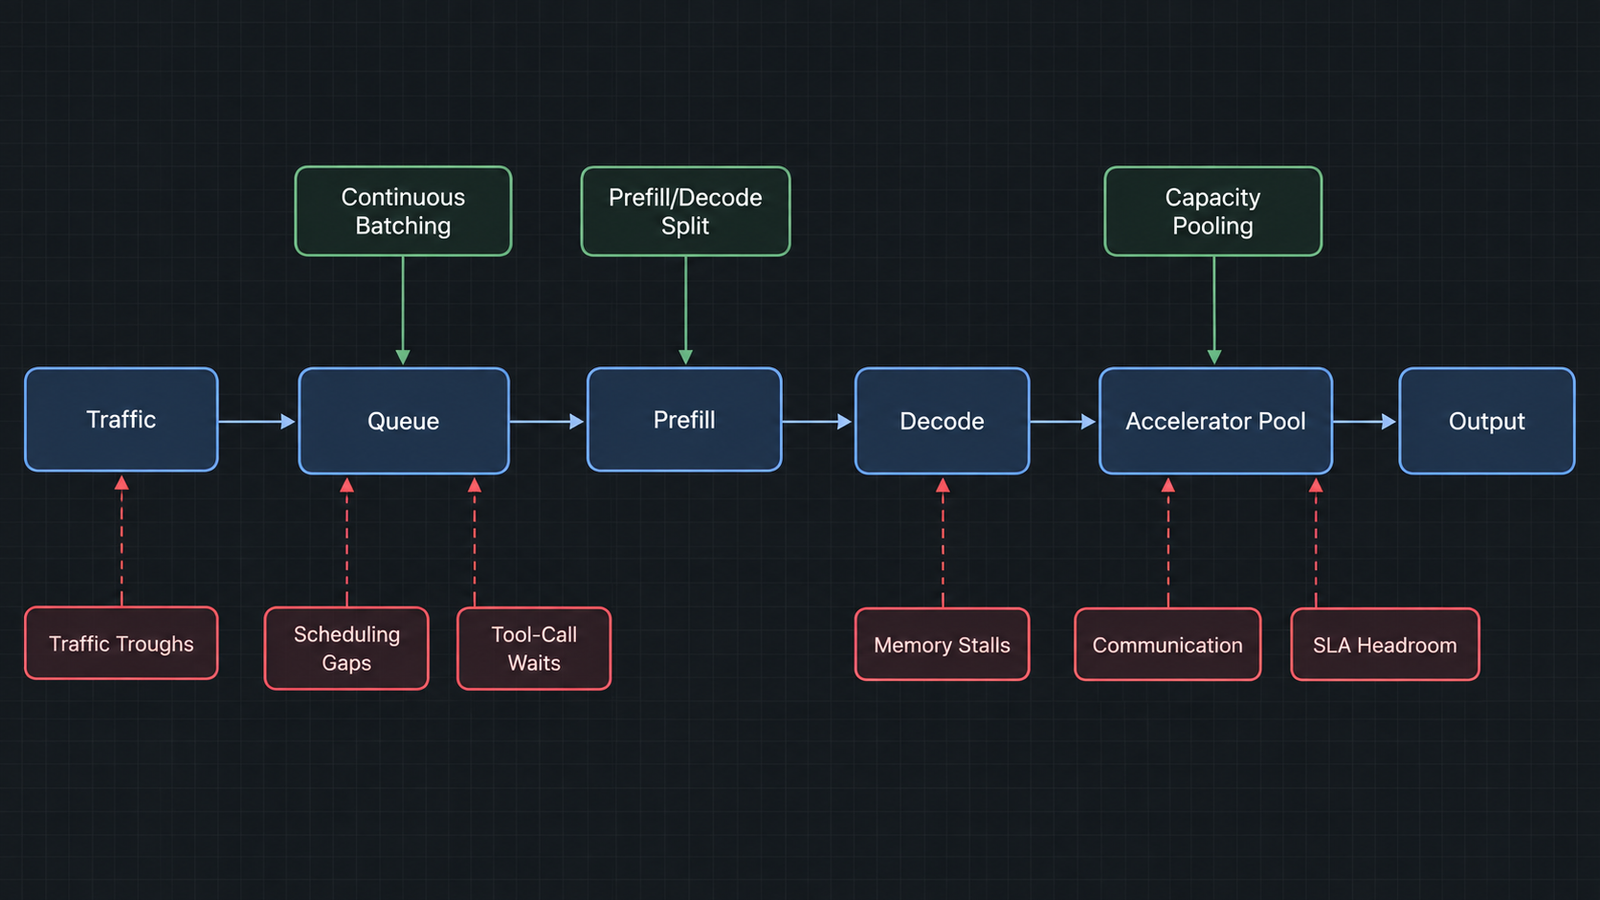
Accelerator Utilisation
Continuous batching

Continuous batching works by deciding batch membership at every model iteration rather than once per batch. A finished sequence is evicted immediately and a waiting request takes its slot on the next iteration, so the accelerator does not sit half-empty waiting for the slowest sequence to complete.

The problem it solves is specific to autoregressive generation. Requests in a batch finish at different times because output lengths vary, sometimes by a factor of ten. Under static batching, a batch of 32 where 30 sequences finish at 50 tokens and 2 run to 500 leaves the accelerator computing over 30 empty slots for the remainder — and new arrivals wait for the whole batch to drain, inflating time-to-first-token.

The technique came from the Orca paper at OSDI 2022, which introduced iteration-level scheduling and reported a 36.9x throughput improvement over FasterTransformer at comparable latency. Anyscale’s later benchmarking measured up to 23x over static batching using vLLM, with the additional gains coming from the memory management that iteration-level scheduling makes possible. It now ships by default in vLLM, SGLang and TensorRT-LLM, where it is sometimes called in-flight batching.

The trade-off is latency variance. Higher batch occupancy means more sequences sharing each forward pass, which raises throughput and can raise per-token latency for any individual stream. Long prefills can still stall decode, which is what chunked prefill addresses.

If you are running a serving stack from the last few years, you already have this. The remaining question is whether its settings — maximum concurrent sequences, chunk size — match your traffic.

Prefill-decode disaggregation

Disaggregation separates the two phases onto different accelerator pools. Prefill workers process prompts, transfer the resulting KV cache to decode workers, and the decode pool generates tokens.

The argument for it follows directly from the phase behaviour. Each pool can be sized, tuned and even hardware-matched for one job instead of compromising between two, and long prefills stop interrupting decode streams because they are happening on different devices.

The cost is the transfer. Every request’s KV cache must move from the prefill pool to the decode pool, and that state is large. NVIDIA’s Dynamo uses NIXL to move KV tensors directly between the VRAM of the prefill and decode engines over NVLink or InfiniBand, with the transfer non-blocking so the forward pass can continue serving other requests during it. The engineering effort visible in that design — topology-aware placement to keep transfers inside a network domain, proposals to transfer only the KV blocks a decode worker does not already hold — is a reasonable indicator of how much the transfer cost matters.

Disaggregation is not universally better. It adds a routing layer, a transport dependency and a second pool to operate and capacity-plan. It pays off most clearly at scale, with high input-to-output token ratios such as RAG and summarisation, and where prefill interference is measurably hurting inter-token latency. For a single-node deployment serving moderate traffic, the complexity usually is not worth it.

Capacity pooling

The third mechanism attacks demand variance rather than serving mechanics: put more workloads on the same capacity so the troughs of one fill the peaks of another.

Approaches that work in practice:

  • Multi-tenant serving, where many customers or internal teams share a fleet, smoothing individual variance
  • Model sharing, serving several fine-tunes as adapters over one resident base model rather than loading each separately
  • Flexible workload scheduling, running batch jobs, evaluation and offline scoring in the gaps left by interactive traffic
  • Geographic pooling, where time-zone offsets mean one region’s trough coincides with another’s peak
  • Routing, directing requests to the pool with capacity and the right cached prefix

The trade-offs are real and belong in the decision:

BenefitCost
Smoothed demandNoisy neighbours affecting tail latency
Higher average utilisationIsolation and data-residency constraints
Better amortisation of loaded modelsCold starts when switching models
Absorbed spikesRouting complexity and a new failure domain

For regulated workloads, isolation requirements may rule out pooling entirely, and that constraint is not negotiable against a utilisation target. Where pooling is available, it is often the largest single improvement, because demand variance is usually the biggest source of idle capacity — and unlike the other two mechanisms, it needs no change to the serving stack.


Turning Accelerator Utilisation Into Cost Per Token

The chain from hardware to invoice runs like this:

Accelerator cost → available capacity → achieved throughput → utilisation → cost per token → cost per request

The first term is fixed. Whether you rent by the hour or amortise a purchase, that number does not change with how busy the device is. Everything downstream is variable, which means all the variance in cost per token comes from the right-hand side of the chain.

The arithmetic that matters:

Cost per million tokens = (accelerator hourly cost ÷ tokens produced per hour) × 1,000,000

Here is what that does in practice. Every figure below is an illustrative assumption, not a vendor quote or a measured benchmark. Assume an accelerator costing $3.00 per hour and a model that, at full batch occupancy on that device, could produce 3,000 output tokens per second.

ScenarioAchieved tokens/secTokens/hourCost per 1M output tokens
Batch size 1, no batching90324,000$9.26
Static batching, partly drained batches7502,700,000$1.11
Continuous batching, steady traffic2,4008,640,000$0.35
Continuous batching, 40% duty cycle from demand troughs9603,456,000$0.87

Same hardware. Same hourly price. A 26x spread in effective cost, driven entirely by how much useful work each hour contained.

Two things in that table are worth dwelling on. The jump from row one to row three is what serving-stack improvements buy. The drop from row three to row four is what demand variance takes back — and notice that the fourth row has an excellent serving stack and still costs 2.5x the third, because the accelerators are idle 60% of the time.

That is the argument for treating utilisation as an economic variable rather than an ops metric. A team that has already deployed continuous batching can still be paying multiples of its theoretical cost floor, and no serving-layer optimisation will fix it. The remedy is pooling, scheduling or right-sizing.

The cost-per-token framework itself — input against output pricing, cache reads, the difference between token cost and cost per completed task — we set out in our breakdown of what inference actually costs per token. Utilisation is the multiplier sitting underneath all of it, and where it fits in the broader infrastructure picture is covered in our map of the AI compute stack.

One caution about the table above: it models output tokens only. Real workloads pay prefill cost too, and for RAG or long-context traffic prefill can dominate. A complete model needs both, which is why the measurement section below asks for input and output token counts separately.


What Your Accelerator Utilisation Dashboard Should Show

One number cannot carry this. A usable view needs six groups, and they answer different questions.

GroupMetricsThe question it answers
CapacityDevices provisioned, devices allocated, devices servingHow much hardware exists and how much is assigned
ActivityGPU utilisation, SM activity, SM occupancy, Tensor Core activity, memory used, achieved memory bandwidthHow busy the silicon is, and at what depth
ThroughputOutput tokens/sec, input tokens/sec, requests/sec, batch sizeHow much work is coming out
LatencyTTFT, inter-token latency, p50, p95, p99, queue timeWhether the service is meeting its commitments
CostCost per request, cost per million tokens, useful work per accelerator-hourWhat it is actually costing
IdleTime attributed to each idle category belowWhere the lost capacity went

The idle breakdown is the part most teams do not have, and it is the one that tells you what to fix. Categorise it:

  • No demand — nothing to serve. Fix with pooling, scheduling or right-sizing.
  • Queueing and scheduling gaps — work waiting while the device is not full. Fix at the scheduler.
  • Tool-call waits — agent requests holding state while external services respond. Fix with concurrency or cache policy.
  • Memory stalls — compute waiting on HBM. Fix with batching, quantisation or better kernels.
  • Communication — collectives and transfers in distributed serving. Fix with topology and parallelism strategy.
  • Model loading — cold starts and weight loading. Fix with warm pools or adapter sharing.
  • Failures and retries — work done twice or thrown away.
  • SLA headroom — deliberate. Do not fix; label it and defend it.
  • Orchestration overhead — time in your own routing and serving layers.

The last category on that list is the reason the exercise is worth doing. Without it, every idle minute looks identical on a graph, and the team optimises whichever cause it happened to guess.


A 50-Request Test You Can Run This Week

Take 50 to 100 requests that look like your real production traffic — not curated examples, not the happy path — and replay them against your serving stack while recording everything.

Per request, capture: input tokens, output tokens, TTFT, total latency, queue time, batch size at admission, tool-call waiting time where relevant, retries, failures, and the cost computed from your own hourly rate.

Across the run, capture: p50, p95 and p99 latency, aggregate tokens per second, accelerator utilisation, SM activity, and achieved memory bandwidth.

Then read the results against this table, which is how you turn the numbers into a decision:

What you observeLikely bottleneckWhere to look
Low utilisation, low queue timeInsufficient demandPooling, scheduling, fleet size
Low utilisation, high queue timeScheduling or admissionBatching configuration, concurrency limits
High utilisation, low throughputMemory bandwidth or small batchesBatch size, quantisation, kernel efficiency
High TTFT, acceptable inter-token latencyPrefill contention or queueingChunked prefill, disaggregation
Inter-token latency spikes mid-generationLong prefills interrupting decodeChunked prefill, prefill routing
Utilisation swings hour to hourDemand variancePooling, autoscaling, batch backfill
Long wall-clock time, low accelerator timeAgent orchestration and tool latencyNot an accelerator problem — look at the tools
High retry rateErrors, timeouts, capacity limitsServing errors, admission control

Fifty requests will not give you statistical confidence. They will give you the shape of the distribution and a defensible answer to the only question that matters at this stage: which layer is actually costing you money. Run it again after every change, because the bottleneck moves.


What Accelerator Utilisation Can and Cannot Tell You

It can tell you whether hardware is sitting completely idle, which is worth knowing and easy to act on.

It can, read over time, show you the shape of your demand and therefore how much of your bill is structural rather than technical.

It cannot tell you whether the work being done is useful, whether the chip is being used efficiently while busy, or whether your latency commitments are being met. For those you need throughput, the deeper activity counters and the latency distribution.

The useful mental shift is to stop treating utilisation as a health metric and start treating it as a cost variable — one that can be moved deliberately, in known directions, by known techniques, with known trade-offs:

  • Scheduling gaps → continuous batching
  • Phase interference → chunked prefill, then disaggregation if the scale justifies it
  • Demand variance → pooling, flexible workload scheduling, right-sizing
  • Tail-latency headroom → leave it alone and label it

A fleet running at 55% because it protects a p99 commitment and backfills nothing is telling you something specific: there is money on the table, and it is in the backfill, not the serving stack. A fleet at 90% with poor throughput is telling you something different. The number alone says neither.


Frequently Asked Questions

What is accelerator utilisation in AI inference?

Accelerator utilisation measures the proportion of time an AI accelerator is executing work. As commonly reported by tools such as nvidia-smi and DCGM, it is the percentage of a sampling period during which at least one kernel was running. It measures occupancy over time, not how much of the hardware’s capacity that work consumed.

Why is GPU utilisation low during LLM inference?

Usually one of four reasons: there is not enough demand to fill the hardware, requests are waiting in a queue while batches are not full, the workload is memory-bandwidth-bound so compute units idle while waiting on HBM, or capacity is deliberately reserved to protect tail latency.

How does accelerator utilisation affect inference cost?

Directly. The cost of an accelerator-hour is fixed, so cost per token equals that hourly cost divided by the tokens produced in the hour. Halving useful throughput doubles the effective cost of every token, with no change in the hardware bill.

Why are prefill and decode different?

Prefill processes all input tokens in parallel as large matrix operations and tends to be compute-intensive. Decode generates one token at a time per sequence, reading model weights and the KV cache at each step, and tends to be limited by memory bandwidth. The tendencies are strong but not absolute — short prompts and large decode batches both shift where the bottleneck falls.

What is continuous batching?

Continuous batching decides batch membership at every model iteration rather than fixing it for the life of a batch. When a sequence finishes it is evicted immediately and a waiting request takes its place on the next iteration, so the accelerator does not idle waiting for the slowest sequence. It originated with the Orca paper at OSDI 2022 as iteration-level scheduling and is now standard in vLLM, SGLang and TensorRT-LLM.


Keep reading

AGI vs superintelligence

AGI vs Superintelligence: A New Name Isn’t a New Intelligence

Facts checked against official documents and reporting on 18 November 2026. On 29 September, the White House told federal agencies to stop writing “artificial intelligence” …
AI Coding Agent

AI Coding Agents Are Getting Expensive. Who’s Paying for the Tokens?

Pricing checked on official vendor pages on 17 November 2026. All USD. Cost scenarios are illustrative and labelled as such. On 28 October, TechCrunch published …
Model Weights

Verify Model Weights: 7 Checks Before You Download
Checked against the burner22/numbat repository and its discussions, Hugging Face and PyTorch documentation, and Moonshot AI’s announcement on 2 November 2026. On 1 November, a …
Agentic AI Statistics

30 Agentic AI Statistics for 2026: Adoption, Spending and Risk

Last updated: 15 November 2026. This page is updated monthly; each figure keeps its original publication date. Agent traffic at one healthcare booking platform rose …